
GRMN: Navigating to higher valuations
- Markets expect GRMN to see Adjusted ROA fade from current 17% levels to historically low levels of 11% over the next 5 years, however, there are reasons to believe this is unwarranted
- Particularly, management is confident about recent gross margin improvements and about their incremental growth opportunities outside of navigation, which should help them maintain current margins and exceed growth expectations
- GRMN currently trades at a 2.2x Adjusted P/B metric, which is in line with its peer group, but with strong growth prospects, there is potential for multiple expansion with limited equity downside
- GRMN’s returns are materially distorted by how as-reported GAAP accounting treats R&D as an expense as opposed to an investment
Embedded Expectations Analysis
As investors, understanding what the market is embedding in the stock price in terms of expectations is paramount to making good decisions. Without understanding what the market is pricing in, it is impossible to claim that the market is wrong. We derive market expectations for the firm from valuations and historical performance trends, to give a clearer picture into what the market is projecting for the firm.
GRMN is currently trading at a 14.7x UAFRS-based P/E (Fwd V/E’), which is near historical averages. At these levels, the market is pricing in expectations for UAFRS-based ROA to decline from 17% in 2016 to 11% by 2021, accompanied by 7% UAFRS-based Asset growth. These expectations imply the market believes the firm’s competitive advantage has completely dissolved, and the firm will see profitability fade towards historical corporate averages. However, several indicators, including recent profitability trends and management sentiment signal that these expectations may be too negative.
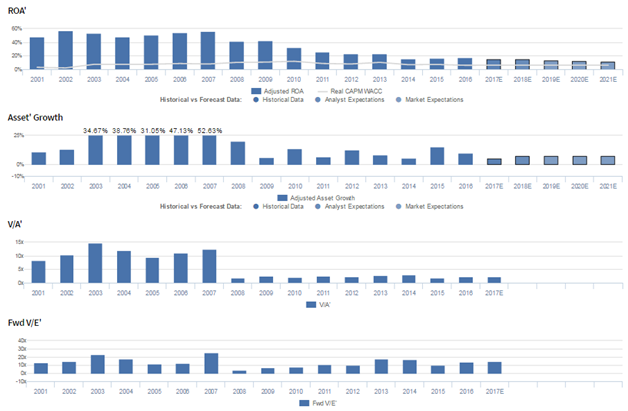
Performance and Valuation Prime™ Chart
Garmin Ltd. (GRMN) is a leading manufacturer of GPS navigation and wireless devices and applications designed for people who live an active lifestyle. The firm designs, develops, manufactures, and distributes GPS enabled products through their automotive, aviation, fitness, marine, and outdoor segments. Since 2014, GRMN has increased efforts to diversify their revenue streams away from their automotive segment, as the Personal Navigation Device (PND) space has struggled since the introduction of Google Maps in 2008. As a result, the firm’s other four segments represent 71% of 2016 revenue and 84% of 2016 operating income.
Prior to 2008, GRMN saw consistently robust profitability, with Adjusted ROA ranging between 47%-57% from 2001-2007. However, in 2008, with the introduction of the Google Maps app, Adjusted ROA immediately fell to 41% and continued falling to a low of 15% in 2014 as GPS unit sales continually decreased. Since 2014 however, profitability has inflected slightly positively, most recently improving back to 17% as GRMN has had success diversifying their product base. Meanwhile, the firm saw fairly robust Adjusted Asset growth prior to the Google Maps era, with consistent, 30%+ Adjusted Asset growth from 2003-2007, but has since seen more muted, but consistently positive growth, which has ranged from 5%-15%.
Given GRMN’s positive momentum in Adjusted ROA since 2014, paired with their growing market share and the potential for further margin expansion, current market expectations for all-time low levels of profitability are likely too bearish.
For context, the PVP chart above reflects the real, economic performance and valuation measures of Garmin Ltd. (GRMN) after making many major adjustments to the as-reported financials. This chart, along with all of the charts included in this article, as well as the detail behind the graphics, can be found here.
Peer Analysis – Valuations Relative to Profitability
A major benefit of adjusting as-reported financial statements is to clear away accounting distortions to allow for more accurate peer-to-peer comparisons. To this end, we have included a scatter chart below that plots GRMN against its peers based on their Adjusted Price-to-Assets ratio (V/A’) and Adjusted ROA (ROA’).
Looking across industries, markets, and time, there has been a very strong relationship between a company’s ROA’ relative to the corporate average (6%) ROA’, and the multiple the market will pay above the value of the company’s Asset’ base, in terms of a UAFRS-based P/B (V/A’) multiple. A company that generates a 6% ROA’ will tend to trade at a 1.0x Adjusted P/B, and a company that generates an 18% ROA’ will trade at a 3.0x Adjusted P/B, etc.
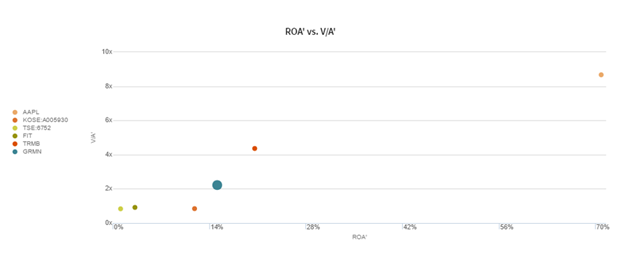
Relative to its peers, GRMN is likely fairly valued at worst. Its 2.2x UAFRS-based P/B (V’A) and 15% Adjusted ROA place it in-line with its competitors, not considering growth potential related to their newer business segments. In order to justify current valuations, GRMN would need to see nearly no incremental growth, while their Adjusted ROA would need to continue compressing to historically low levels.
Analyst and Management Expectations
Analysts have less bearish expectations than the market, projecting Adjusted ROA to fade slightly to 15% by 2018, accompanied by 5% Adjusted Asset growth.
In addition, Valens’ qualitative analysis of the firm’s Q4 2016 earnings call highlights that management is confident that they see incremental growth opportunities in RV, cameras, and OEM, and that they have driven recent market share gains. Moreover, they were confident when saying gross margin was impacted by product mix, and that they finished 2016 on a strong note.
Given management’s confidence about gross margin improvements, their growth opportunities, and their recent market share gains, GRMN appears poised to maintain current levels of profitability at worst, and in that scenario equity upside would be warranted.
Performance Drivers – Sales, Margins, and Turns
It can be helpful to break down Adjusted ROA into its DuPont formula parts, UAFRS Earnings Margin and UAFRS Asset Turnover, which are cleaned up margins and turns metrics used to calculate Adjusted ROA. The chart below details both Adjusted Earnings Margin and Adjusted Asset Turns historically, to help us better understand the drivers of the firm’s profitability and performance.
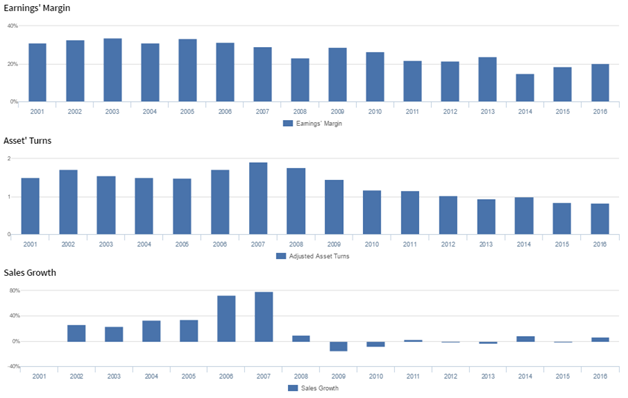
GRMN’s recent Adjusted ROA compression has been driven by compounding downturns in both UAFRS Earnings Margins and Asset Turns. From 2001-2007, Adjusted Earnings Margins ranged from 29%-34%, before compressing to 23% in 2008, and compressing further to lows of 15% in 2014. That said, they saw Adjusted Margins positively inflect since, again reaching 20% in 2016. Meanwhile, Adjusted Asset Turns, which ranged from 1.5x-1.9x from 2001-2007, have slowly compressed to lows of 0.8x in 2016.
For the company to continue fading to historically low profitability, they would need to see Adjusted Earnings Margins inflect negatively once again, while Adjusted Asset Turns would have to continue reaching new lows. However, as mentioned above, management is confident about their gross margin improvements being driven by a stronger mix, and about their incremental growth opportunities in RV, camera, and OEM. As a result, in particular, Adjusted Earnings Margins, but also Adjusted Asset Turns, will likely remain flat if not improve going forward. This makes it unlikely the company will see returns decline to levels to warrant current valuations.
Impact of UAFRS Adjustments
This analysis uses Uniform Adjusted Financial Reporting Standards (UAFRS) metrics, or adjusted metrics, which remove accounting distortions found in GAAP and IFRS to reveal the true economic profitability of a firm. This allows us to better understand the real historic economic profitability of a firm as well as allows for better comparability between peers. To better understand UAFRS, please refer to our explanation here.
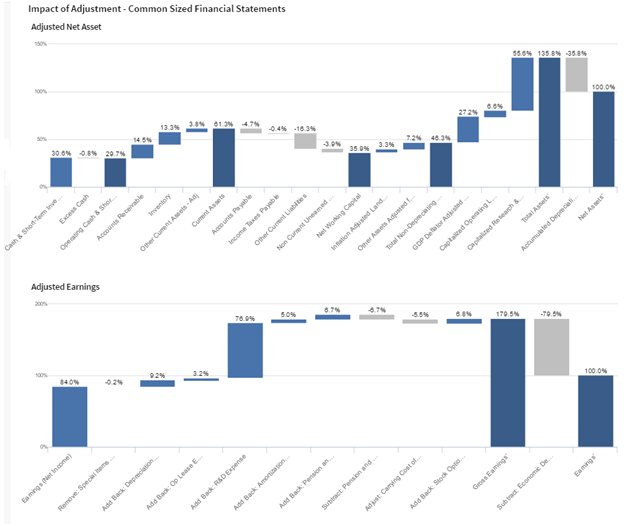
The chart above highlights via common-size financial statements the impact UAFRS adjustments have on GRMN’s asset base and earnings. The largest adjustment to the firm’s Adjusted Net Asset base and Adjusted Earnings comes from UAFRS capitalization of R&D expense.
GRMN has regular, and material investments in R&D each year that as-reported financial statements treat as expenses. This violates one of the core principles of accounting, which is that expenses should be recognized in the period when the related revenue is incurred. R&D investment is an investment in the long-term cash flow generation of the company. Because as-reported metrics treat R&D investment as an expense, as opposed to an investment, net income is artificially decreased.
Valuation Matrix – ROA’ and Asset’ Growth as Drivers of Valuation
When valuing a company, it is important to consider more than a singular target price, and instead the potential value of a firm at various levels of performance. The below matrix highlights potential prices for GRMN at various levels of profitability (in terms of Adjusted ROA) and growth (Adjusted Asset growth). Prices that are in excess of 10% equity upside are highlighted in black, and prices representing an excess of 10% equity downside are highlighted in red.
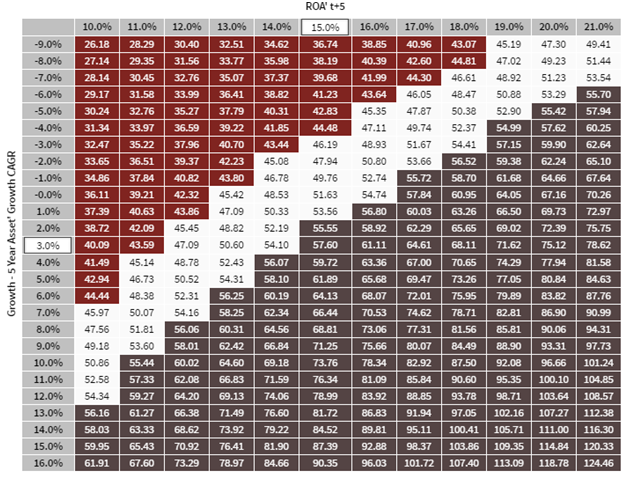
To justify current prices, GRMN would need to see Adjusted ROA fade back to historical lows of 15%, accompanied by 2% Adjusted Asset growth going forward. Given the fact that the firm has consistently grown its Adjusted Asset base between 5%-15% over the past eight years, and management sentiment indicates that Adjusted ROA is likely to remain stable if not continue improving in the upcoming years, markets appear to be pricing in the worst-case scenario, limiting near-term equity downside.
Moreover, when considering fundamental tailwinds and management communication signals, the firm may exceed market expectations, potentially driving material equity upside going forward.
To find out more about Garmin Ltd. (GRMN) and how their performance and market expectations compare to peers, click here to access the open beta of the Valens Research database.
Our Chief Investment Strategist, Joel Litman, chairs the Valens Equities and Credit Research Committees, which are responsible for this article. Professor Litman is regarded around the world for his expertise in forensic accounting and “forensic fundamental” analysis, particularly in corporate performance and valuation.


