Rising nervousness surrounds fintech players as tech giant Apple penetrates the space. Today’s FA Alpha Daily will feature Global X FinTech ETF to dissect the performance and prospects of its holdings.
FA Alpha Daily:
Friday Portfolio Analysis
Powered by Valens Research
The FinTech space in recent years has soared to new heights as money and technology have intersected to revolutionize traditional processes.
After creating media giants, and making other existing processes smoother, software engineers have instead set their sights on creating better and more accessible financial services.
Some of the most prominent examples of these industries include payment processors, banking services, and trading platforms.
But the list doesn’t stop there. And neither do the surprises.
FinTech certainly got a shock earlier this week on Apple’s (AAPL) news that it isn’t just processing payments on its platform, or even going out on its own without Goldman Sachs by becoming a bank.
Rather, it is now going into the buy now, pay later space.
As Apple has done for years now, they have surveyed the financial technology space over the past ten years and have identified this industry as an area of massive opportunity.
As more and more commerce revolves around mobile phones, this has become an area of massive untapped potential.
While this news is great for owners of iPhones and technology in the Apple ecosystem, as well as investors of Apple itself, it has one group of investors very worried.
The ones worrying are those that have been betting that fintech innovators were going to disrupt the financial system and start a revolution.
And instead, Apple is effectively saying it’s going to do it.
For those looking to play the industry as a whole, the Global X FinTech ETF has been a popular way.
Therefore, it’s no surprise that with Apple going after the space, the ETF has tumbled.
Let’s take a look using Uniform Accounting at the quality of those companies and see if Apple is right to be going after the space, and if their valuations price in that competition or not yet.
Economic productivity is massively misunderstood on Wall Street. This is reflected by the 130+ distortions in the Generally Accepted Accounting Principles (GAAP) that make as-reported results poor representations of real economic productivity.
These distortions include the poor capitalization of R&D, the use of goodwill and intangibles to inflate a company’s asset base, a poor understanding of one-off expense line items, as well as flawed acquisition accounting.
It is no surprise that once many of these distortions are accounted for, it becomes apparent which companies are in real robust profitability and which may not be as strong of an investment.
Just as one would expect, there is still merit to investing in companies that combine the power of finance and technology, as the Uniform returns are much stronger than the as-reported metrics dictate.
See for yourself below.
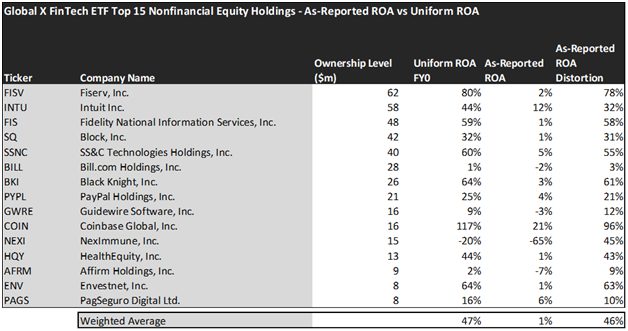
Using as-reported accounting, investors would think investing in FinTech companies would result in the portfolio achieving a very weak return on assets (ROA).
On an as-reported basis, many of these companies are poor performers that destroy value by operating with an average as-reported ROA of around 1%.
However, once we make Uniform Accounting (UAFRS) adjustments to accurately calculate earning power, we can see that the returns of the companies in the Global X FinTech ETF are much more robust.
The average company in the portfolio displays an impressive average Uniform ROA of 47%. This is significantly above corporate average returns and representative of the high growth and success that the industry has experienced.
Once the distortions from as-reported accounting are removed, we can realize that Fiserv (FISV) doesn’t have an ROA of 2%, but returns of 80%.
Similarly, Intuit’s (INTU) ROA is really 44%, not 12%. Intuit has created a strong portfolio of products that make money management and filing taxes easier and more accessible for all consumers.
Block, Inc (SQ), is another great example of as-reported metrics mis-representing the company’s profitability. With a Uniform ROA of 32%, an as-reported of 1% is wholly misleading and misses the story.
If investors were to look at the industry as powered by as-reported metrics, they would think that Apple is crazy to enter an industry with such low profitability.
To find companies that can deliver alpha beyond the market, just finding companies where as-reported metrics mis-represent a company’s real profitability is insufficient.
To really generate alpha, any investor also needs to identify where the market is significantly undervaluing the company’s potential.
Apple is thinking of investing in an industry that has a strong record of profitability, but we need to also see if they have a strong upside scenario going forward.
Once we account for Uniform Accounting adjustments, we can see that many of these companies are strong stocks but have already realized most of their potential.
These dislocations demonstrate that most of these firms are in a different financial position than GAAP may make their books appear. But there is another crucial step in the search for alpha. Investors need to also find companies that are performing better than their valuations imply.
Valens has built a systematic process called Embedded Expectations Analysis to help investors get a sense of the future performance already baked into a company’s current stock price. Take a look:
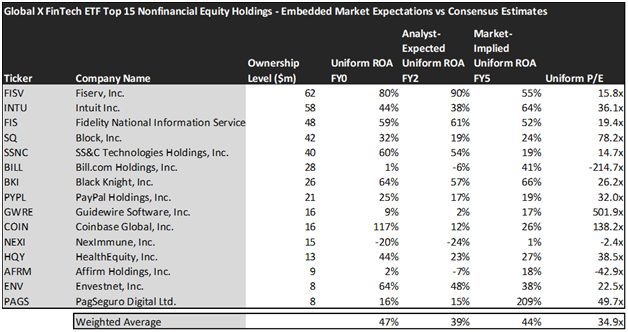
This chart shows four interesting data points:
- The Uniform ROA FY0 represents the company’s current return on assets, which is a crucial benchmark for contextualizing expectations.
- The analyst-expected Uniform ROA represents what ROA is forecasted to do over the next two years. To get the ROA value, we take consensus Wall Street estimates and convert them to the Uniform Accounting framework.
- The market-implied Uniform ROA is what the market thinks Uniform ROA is going to be in the three years following the analyst expectations, which for most companies here is 2023, 2024, and 2025. Here, we show the sort of economic productivity a company needs to achieve to justify its current stock price.
- The Uniform P/E is our measure of how expensive a company is relative to its Uniform earnings. For reference, the average Uniform P/E across the investing universe is roughly 24x.
Embedded Expectations Analysis of Global X FinTech ETF paints a clear picture of the fund. While the stocks it tracks are strong performers historically, the markets are pricing them to slightly decline in profitability, while analysts are expecting a steeper decline.
While analysts forecast the fund to see Uniform ROA fall to 39% over the next two years, the market is pricing the fund to drop to just 44% levels. This may lead to downside risk as the names deteriorate faster than the market expects.
In particular, there are a couple of companies that may lead investors to be cautious.
The markets are expecting Intuit’s Uniform ROA to rise to 64%. Meanwhile, analysts are projecting the company’s returns to drop to 38%.
Bill.com (BILL) may further disappoint investors as their returns are expected to only further decrease to -6% Uniform ROA, while analysts expect them to increase their returns to 41%.
In total, it looks like the risk of disruption for Apple spells the end of the glory days of independent fintech companies. Investors hoping to buy in today looking for a discount may be disappointed.
This just goes to show the importance of valuation in the investing process. Finding a company with strong growth is only half of the process. The other, just as important part, is attaching reasonable valuations to the companies and understanding which have upside which have not been fully priced into their current prices.
To see a list of companies that have great performance and stability also at attractive valuations, the Valens Conviction Long Idea List is the place to look. The conviction list is powered by the Valens database, which offers access to full Uniform Accounting metrics for thousands of companies.
Click here to get access.
Read on to see a detailed tearsheet of Global X FinTech ETF’s largest holdings.
SUMMARY and Fiserv, Inc. Tearsheet
As Global X FinTech ETF’s largest individual stock holding, we’re highlighting Fiserv, Inc. (FISV:USA) tearsheet today.
As the Uniform Accounting tearsheet for Fiserv highlights, its Uniform P/E trades at 15.8x, which is below the global corporate average of 20.6x and its historical average of 19.8x.
Low P/Es require low, and even negative, EPS growth to sustain them. In the case of Fiserv, the company has recently shown a 5% Uniform EPS growth.
Wall Street analysts provide stock and valuation recommendations that, in general, provide very poor guidance or insight. However, Wall Street analysts’ near-term earnings forecasts tend to have relevant information.
We take Wall Street forecasts for GAAP earnings and convert them to Uniform earnings forecasts. When we do this, Fiserv’s Wall Street analyst-driven forecast is for EPS to grow by 26% and 7% in 2022 and 2023, respectively.
Based on the current stock market valuations, we can use earnings growth valuation metrics to back into the required growth rate to justify Fiserv’s $101 stock price. These are often referred to as market embedded expectations.
The company is currently being valued as if Uniform earnings were to shrink by 6% annually over the next three years. What Wall Street analysts expect for Fiserv’s earnings growth is above what the current stock market valuation requires through 2023.
Meanwhile, the company’s earning power is well above long-run corporate averages. Also, cash flows and cash on hand are around 2x the total obligations—including debt maturities and capex maintenance. However, intrinsic credit risk is 110bps. Together, these signal moderate operating and credit risks.
Lastly, Fiserv’s Uniform earnings growth is above peer averages, but is trading below its average peer valuations.
Best regards,
Joel Litman & Rob Spivey
Chief Investment Strategist &
Director of Research
at Valens Research
This portfolio analysis highlights the same insights we use to power our FA Alpha product. To find out more visit our website.