The advent of digitalization and democratization of information has made communication services a necessity, making communication services companies the go-to choice for value investors that are aiming for strong returns. Today’s FA Alpha Daily will unmask the real profitability and performance of the SPDR Communications Services Fund (XLC).
FA Alpha Daily:
Friday Portfolio Analysis
Powered by Valens Research
The rise of digitalization is one of the most important milestones in the last 20 years.
Even at the most basic level, the way we spend time, order food or groceries, and watch our favorite series has totally changed.
We can access whatever we want with the click of a finger.
Thanks to the democratization of information, we often forget about the infrastructure and services that enable us to live so comfortably.
By providing the necessary connection to the internet and cellular line, and the essential services for our smartphones, laptops, and other devices, communication services companies are in a crucial position around the globe.
But the fact that they have become huge, and the supply and demand balance has been reached, they have started to be beaten by the market.
With the recent volatility, the communication services sector lost more than 25% year to date, much worse than the S&P 500 which is only down 16%.
And if we go back in time for around 4 years, to the inception of The SPDR Communications Services Fund, the sector has now only appreciated 15%, which is almost 5 times lower than what an S&P 500 index fund gained.
For many value-minded investors, this would appear to be an opportunity to invest in one of the most essential industries in the world at a discount.
Let’s see how The SPDR Communications Services Fund has been performing and if it is a compelling name for investors.
Economic productivity is massively misunderstood on Wall Street. This is reflected by the 130+ distortions in the Generally Accepted Accounting Principles (GAAP) that make as-reported results poor representations of real economic productivity.
These distortions include the poor capitalization of R&D, the use of goodwill and intangibles to inflate a company’s asset base, a poor understanding of one-off expense line items, as well as flawed acquisition accounting.
It is no surprise that once many of these distortions are accounted for, it becomes apparent which companies are in real robust profitability and which may not be as strong of an investment.
Just as one would expect, there is still merit to investing in companies that combine the power of finance and technology, as the Uniform returns are much stronger than the as-reported metrics dictate.
See for yourself below.
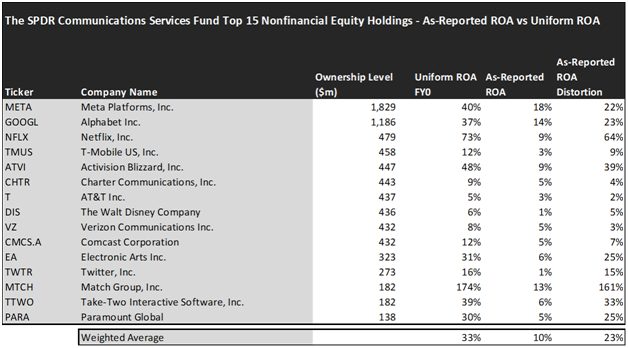
Using as-reported accounting, investors would think investing in one of the most important sectors in the world is not that profitable.
On an as-reported basis, many of these companies are poor performers in terms of profitability and operating with an average as-reported ROA of just 10% which is close to the corporate averages in the United States.
However, once we make Uniform Accounting (UAFRS) adjustments to accurately calculate earning power, we can see that the returns of the companies in The SPDR Communications Services Fund are much more robust.
The average company in the portfolio displays an average Uniform ROA of 33%, which is much higher than corporate average returns.
Once the distortions from as-reported accounting are removed, we can realize that Activision Blizzard (ATVI) doesn’t have an ROA of 9%, but returns of 48%.
Similarly, Netflix’s (NFLX) ROA is actually 73%, not 9%. The company provides its members the ability to receive streaming content through a host of internet-connected devices, including TVs, digital video players, television set-top boxes, and mobile devices. In addition, Netflix is one of the largest streaming platforms in the world.
Match Group (MTCH) is another great example of as-reported metrics misrepresenting the company’s profitability. With a Uniform ROA of 174%, an as-reported of 13% is wholly misleading and misses the story.
To find companies that can deliver alpha beyond the market, just finding companies where as-reported metrics misrepresent a company’s real profitability is insufficient.
To really generate alpha, any investor also needs to identify where the market is significantly undervaluing the company’s potential.
When distortions from as-reported metrics are removed, we can see that the communications sector is in fact packed with high-return companies.
Once we account for Uniform Accounting adjustments, we can see that many of these companies are strong stocks but have already realized most of their potential.
These dislocations demonstrate that most of these firms are in a different financial position than GAAP may make their books appear. But there is another crucial step in the search for alpha.
Investors need to also find companies that are performing better than their valuations imply.
Valens has built a systematic process called Embedded Expectations Analysis to help investors get a sense of the future performance already baked into a company’s current stock price. Take a look:
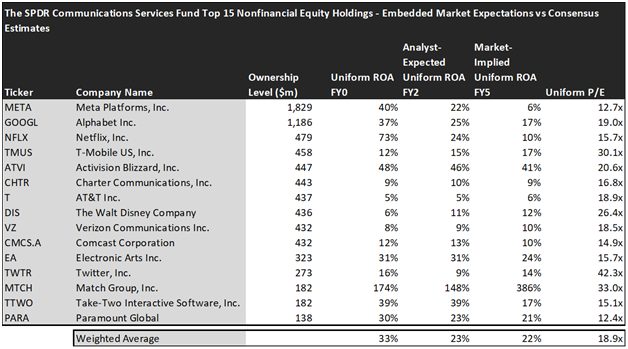
This chart shows four interesting data points:
- The Uniform ROA FY0 represents the company’s current return on assets, which is a crucial benchmark for contextualizing expectations.
- The analyst-expected Uniform ROA represents what ROA is forecasted to do over the next two years. To get the ROA value, we take consensus Wall Street estimates and convert them to the Uniform Accounting framework.
- The market-implied Uniform ROA is what the market thinks Uniform ROA is going to be in the three years following the analyst expectations, which for most companies here is 2023, 2024, and 2025. Here, we show the sort of economic productivity a company needs to achieve to justify its current stock price.
- The Uniform P/E is our measure of how expensive a company is relative to its Uniform earnings. For reference, the average Uniform P/E across the investing universe is roughly 24x.
Embedded Expectations Analysis of The SPDR Communications Services Fund paints a clear picture for investors. As the stocks it tracks are strong performers historically, the markets are pricing them to decline in profitability, while analysts seem to agree with the market.
While analysts forecast the fund to see Uniform ROA decrease to 23% over the next two years, the market is also pricing the fund to see returns fall to 22%, almost the same levels as analysts. This would imply the fund is on average being correctly priced in by the market.
However, there are a couple of companies that may lead investors to be cautious.
The markets are pricing in Match Group (MTCH) Uniform ROA to rise to 386%. Meanwhile, analysts are projecting the company’s returns to decline to 148%.
T-Mobile US (TMUS) may further disappoint investors as their returns are expected to slightly improve to 15% Uniform ROA, while the market expects them to increase their returns to 17%.
To sum up, the portfolio is composed of strong performers and quality names that can deliver impressive returns, but investors should carefully analyze the current investment environment and valuations before making a strategic decision.
This just goes to show the importance of valuation in the investing process. Finding a company with strong growth is only half of the process. The other, just as important part, is attaching reasonable valuations to the companies and understanding which have upside which have not been fully priced into their current prices.
To see a list of companies that have great performance and stability also at attractive valuations, the Valens Conviction Long Idea List is the place to look. The conviction list is powered by the Valens database, which offers access to full Uniform Accounting metrics for thousands of companies.
Click here to get access.
Read on to see a detailed tearsheet of XLC’s largest holding.
SUMMARY and Meta Platforms, Inc. Tearsheet
As XLC’s largest individual stock holding, we’re highlighting Meta Platforms, Inc. (META:USA) tearsheet today.
As the Uniform Accounting tearsheet for Meta Platforms highlights, its Uniform P/E trades at 12.7x, which is below the global corporate average of 19.7x and its historical average of 17.2x.
Low P/Es require low, and even negative, EPS growth to sustain them. That said, in the case of Meta Platforms, the company has recently shown 42% Uniform EPS growth.
Wall Street analysts provide stock and valuation recommendations that, in general, provide very poor guidance or insight. However, Wall Street analysts’ near-term earnings forecasts tend to have relevant information.
We take Wall Street forecasts for GAAP earnings and convert them to Uniform earnings forecasts. When we do this, Meta Platforms’ Wall Street analyst-driven forecast is for EPS to decline by 17% in 2022 but grow by 6% in 2023.
Based on the current stock market valuations, we can use earnings growth valuation metrics to back into the required growth rate to justify Meta Platforms’ $171 stock price. These are often referred to as market embedded expectations.
The company is currently being valued as if Uniform earnings were to shrink by 12% annually over the next three years. What Wall Street analysts expect for Meta Platforms’ earnings growth is below what the current stock market valuation requires in 2022, but above that requirement in 2023.
Furthermore, the company’s earning power is 7x the long-run corporate average. Also, cash flows and cash on hand are nearly 4x the total obligations—including debt maturities and capex maintenance. Moreover, intrinsic credit risk is 30bps. Together, these signal low operating and credit risks.
Lastly, Meta Platforms’ Uniform earnings growth is below peer averages and is trading below average peer valuations.
Best regards,
Joel Litman & Rob Spivey
Chief Investment Strategist &
Director of Research
at Valens Research
This portfolio analysis highlights the same insights we use to power our FA Alpha product. To find out more visit our website.