Germany, like other European countries, is starting to give nuclear energy a second look as the Ukraine-Russia war halts the country’s plan to source 100% of its energy needs from renewable sources. This possible demand boom heightened the interest of investors in ETFs such as the VanEck Vectors Uranium+Nuclear Energy ETF (NLR). Today’s FA Alpha Daily will investigate the fund’s actual profitability and performance under the lens of Uniform Accounting.
FA Alpha Daily:
Friday Portfolio Analysis
Powered by Valens Research
European countries, especially Germany, have been keeping their distance from nuclear energy for almost three decades.
Angela Merkel, former chancellor of Germany, pulled the plug on nuclear power after the effects of the Fukushima Nuclear disaster in 2011.
Germany’s plan was to fuel itself through renewable energy sources but it needed cheap Russian gas for the transition period before becoming fully operational with renewables.
However, the Ukraine-Russia war has disrupted the plans as Russia is cutting off the gas flow to the continent.
As the war triggered the energy crisis, natural gas prices soared immensely and put Germany at a crossroad against its clean energy plans.
Now, Europe is looking for alternative energy sources as Russia tightens the taps. Coal plants are being refired across the continent, and nuclear energy is getting a second look.
Due to the energy crisis and a search for alternative energy, the European Parliament recently took a big step and classified some gas and nuclear power as “green”.
Nuclear is an incredibly environmentally efficient energy source. The controversy around it comes from the potential risks of mishandling the plants, leading to meltdowns.
Germany, one of the least nuclear-friendly nations, announced that it is going to postpone its plan to shut down more nuclear power plants for now.
That is a boost for one of the solutions that are most clear to be able to help the world get away from fossil fuels and to save Europe from the energy crisis.
While the continent warms up to the nuclear energy discussion, investors are looking for ways to be exposed to a possible demand boom in the industry.
One popular ETF for those who want exposure to nuclear energy is VanEck Vectors Uranium+Nuclear Energy ETF.
Let’s look at the NLR ETF through Uniform Accounting lenses to see if its holdings are compelling or not.
Economic productivity is massively misunderstood on Wall Street. This is reflected by the 130+ distortions in the Generally Accepted Accounting Principles (GAAP) that make as-reported results poor representations of real economic productivity.
These distortions include the poor capitalization of R&D, the use of goodwill and intangibles to inflate a company’s asset base, a poor understanding of one-off expense line items, as well as flawed acquisition accounting.
It is no surprise that once many of these distortions are accounted for, it becomes apparent which companies are in real robust profitability and which may not be as strong of an investment.
See for yourself below.
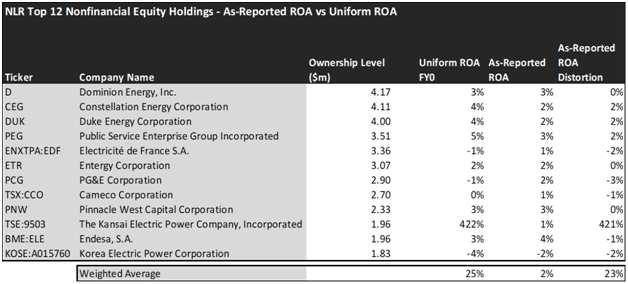
Using as-reported accounting, investors would think investing in the nuclear energy sector is not really rewarding.
On an as-reported basis, many of these companies are poor performers in terms of profitability and operate with an average as-reported ROA of 2%, which is below the corporate averages in the United States of 12%.
However, once we make Uniform Accounting (UAFRS) adjustments to accurately calculate earning power, we can see that the returns of the companies in VanEck Vectors Uranium+Nuclear Energy ETF are much more robust.
The average company in the portfolio displays an impressive average Uniform ROA of 25%, which is approximately double the corporate average.
Once the distortions from as-reported accounting are removed, we can realize that Public Service Enterprise Group (PEG) doesn’t have 3% returns, but a Uniform ROA of 5%.
Similarly, Duke Energy Corporation’s (DUK) ROA is actually 4%, not 2%. Headquartered in Charlotte, N.C., Duke Energy is one of the largest energy holding companies in the United States.
Constellation Energy Corporation (CEG) also looks unprofitable at 2%, but its Uniform ROA is 4%, roughly average for a utility.
To find companies that can deliver alpha beyond the market, just finding companies where as-reported metrics misrepresent a company’s real profitability is insufficient.
To really generate alpha, any investor also needs to identify where the market is significantly undervaluing the company’s potential.
These dislocations demonstrate that most of these firms are in a different financial position than GAAP may make their books appear. But there is another crucial step in the search for alpha. Investors need to also find companies that are performing better than their valuations imply.
Valens has built a systematic process called Embedded Expectations Analysis to help investors get a sense of the future performance already baked into a company’s current stock price. Take a look:
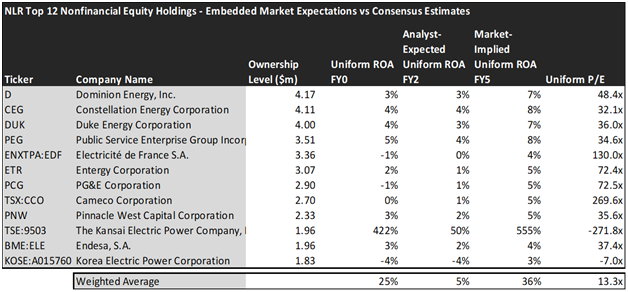
This chart shows four interesting data points:
- The Uniform ROA FY0 represents the company’s current return on assets, which is a crucial benchmark for contextualizing expectations.
- The analyst-expected Uniform ROA represents what ROA is forecasted to do over the next two years. To get the ROA value, we take consensus Wall Street estimates and convert them to the Uniform Accounting framework.
- The market-implied Uniform ROA is what the market thinks Uniform ROA is going to be in the three years following the analyst expectations, which for most companies here are 2023, 2024, and 2025. Here, we show the sort of economic productivity a company needs to achieve to justify its current stock price.
- The Uniform P/E is our measure of how expensive a company is relative to its Uniform earnings. For reference, the average Uniform P/E across the investing universe is roughly 20x.
Embedded Expectations Analysis of VanEck Vectors Uranium+Nuclear Energy ETF paints a clear picture. Over the next few years, Wall Street analysts expect the companies in NLR ETF to decline in profitability, while the market is pricing in their profitability to increase.
Analysts forecast the industry to see Uniform ROA decrease to 5% over the next two years, and the market is pricing the industry to see returns rise to 36%, which may imply some downside risk for the ETF’s holdings and there are a couple of companies that may lead investors to be cautious.
The markets are expecting Cameco Corporation’s (TSX:CCO) Uniform ROA to rise to 5%. Meanwhile, analysts are projecting the company’s returns to slightly improve to 1%, perhaps disappointing investors.
Public Service Enterprise Group, discussed above, may further disappoint investors. Analysts expect its returns to fade from 5% to 4%, while the market expects Uniform ROA to improve to 8%.
For investors that want to be exposed to the nuclear energy sector VanEck Vectors Uranium+Nuclear Energy ETF looks like a good option overall. The ETF’s holdings consist of historically high performers and companies that have growth potential. However, before making any investment decisions, investors should look out for the valuations of the companies.
This just goes to show the importance of valuation in the investing process. Finding a company with strong growth is only half of the process. The other, just as important part, is attaching reasonable valuations to the companies and understanding which have upside which has not been fully priced into their current prices.
In the case of the nuclear discussion, the market seems like it’s already buying the story that Europe might turn on more nuclear in the future. It would take extremely positive circumstances for the market to be surprised to the upside.
To see a list of companies that have great performance and stability also at attractive valuations, the Valens Conviction Long Idea List is the place to look. The conviction list is powered by the Valens database, which offers access to full Uniform Accounting metrics for thousands of companies.
Click here to get access.
Read on to see a detailed tearsheet of one of VanEck Vectors Uranium+Nuclear Energy ETF’s largest holdings.
SUMMARY and Dominion Energy, Inc. Tearsheet
As one of NLR’s largest individual stock holdings, we’re highlighting Dominion Energy, Inc. (D:USA) tearsheet today.
As the Uniform Accounting tearsheet for Dominion Energy highlights, its Uniform P/E trades at 49.3x, which is above the global corporate average of 19.3x, but around its historical average of 48.8x.
High P/Es require high EPS growth to sustain them. That said, in the case of Dominion Energy, the company has recently shown 31% Uniform EPS shrinkage.
Wall Street analysts provide stock and valuation recommendations that, in general, provide very poor guidance or insight. However, Wall Street analysts’ near-term earnings forecasts tend to have relevant information.
We take Wall Street forecasts for GAAP earnings and convert them to Uniform earnings forecasts. When we do this, Dominion Energy’s Wall Street analyst-driven forecast is for EPS to grow by 16% and 38% in 2022 and 2023, respectively.
Furthermore, the company’s return on assets was 3% in 2021, which is below the long-run corporate averages. Also, cash flows and cash on hand are below its total obligations—including debt maturities and CAPEX maintenance. Moreover, its intrinsic credit risk is 100bps above the risk-free rate. Together, these signal moderate credit risks.
Lastly, Dominion Energy’s Uniform earnings growth is above peer averages, and trading in above-average peer valuations.
Best regards,
Joel Litman & Rob Spivey
Chief Investment Strategist &
Director of Research
at Valens Research
This portfolio analysis highlights the same insights we share with our FA Alpha Members. To find out more, visit our website.