We’ve all heard about bull and bear markets. They’re the names we give to market upturns and downturns over the course of a full market cycle.
For those that have kept a close eye on financial markets in the past couple of decades, there is another animal that gets spoken about a lot.
The tiger.
While Chase Coleman, the mastermind behind Tiger Global, follows the animal’s tendencies by avoiding the spotlight and operating in a lithe manner, in contrast to some of his hedge fund peers, that isn’t what we are alluding to.
Rather, it’s an ode to all of the Tiger cubs that were offsprings of Julian Robertson’s legendary fund Tiger Management.
Back in March, we talked about how the Tiger cubs, particularly Tiger Global, rode the venture capital and technology wave to new heights over the past ten years.
Just as quickly as investors’ investments ascended, they have come barrelling back to the earth, punishing investors along the way.
A recent assessment clocked their losses at over $17 billion of investors’ money, all lost in the tumult of the past few months. In fact, this represents a loss of roughly two-thirds of total gains since inception of Chase Coleman’s hedge fund.
With such drastic losses in the rearview mirror, have they pivoted the portfolio to survive better going forward? Or do they have a blind spot in their investment philosophy?
Let’s take a look using Uniform Accounting to see if Tiger Global is poised to recover going forward.
Economic productivity is massively misunderstood on Wall Street. This is reflected by the 130+ distortions in the Generally Accepted Accounting Principles (GAAP) that make as-reported results poor representations of real economic productivity.
These distortions include the poor capitalization of R&D, the use of goodwill and intangibles to inflate a company’s asset base, a poor understanding of one-off expense line items, as well as flawed acquisition accounting.
It is no surprise that once many of these distortions are accounted for, it becomes apparent which companies are in reality robustly profitable and which may not be as strong of an investment.
Just as one would expect from an investor that has reported such strong returns since inception, the Uniform returns are much stronger than the as-reported metrics dictate.
See for yourself below.

The average as-reported ROA among Tiger Global’s top 15 names is a barely profitable 2%. In reality, though, these companies are much more profitable on average, with an 8% Uniform ROA across the top fifteen.
Microsoft Corporation (MSFT) for example doesn’t have average 14% returns. Rather, it has a 35% Uniform ROA.
Similarly, CrowdStrike (CRWD), isn’t a money-losing business at a -3% ROA. Instead, the company has produced a 14% Uniform ROA.
Some of Tiger Global’s other investments are also much stronger than they appear. For example, Shopify (SHOP) doesn’t have 2% returns. Instead, they have achieved a 42% Uniform ROA.
Largely, once we account for Uniform Accounting adjustments, we can see that many of these companies are strong stocks that have unfairly been beaten down by occluded accounting standards.
These dislocations demonstrate that most of these firms are in a different financial position than GAAP may make their books appear. But there is another crucial step in the search for alpha. Investors need to also find companies that are performing better than their valuations imply.
Valens has built a systematic process called Embedded Expectations Analysis to help investors get a sense of the future performance already baked into a company’s current stock price. Take a look:
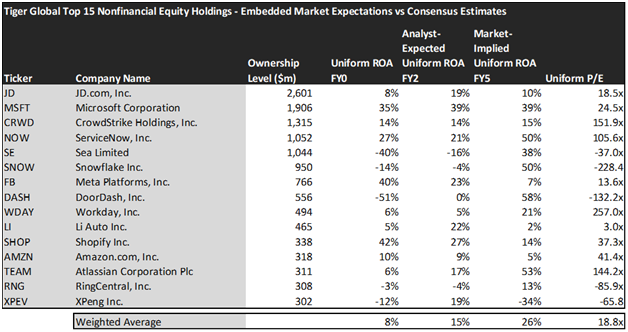
This chart shows four interesting data points:
- The Uniform ROA FY0 represents the company’s current return on assets, which is a crucial benchmark for contextualizing expectations.
- The analyst-expected Uniform ROA represents what ROA is forecasted to do over the next two years. To get the ROA value, we take consensus Wall Street estimates and we convert them to the Uniform Accounting framework.
- The market-implied Uniform ROA is what the market thinks Uniform ROA is going to be in the three years following the analyst expectations, which for most companies here is 2023, 2024, and 2025. Here, we show the sort of economic productivity a company needs to achieve to justify its current stock price.
- The Uniform P/E is our measure of how expensive a company is relative to its Uniform earnings. For reference, average Uniform P/E across the investing universe is roughly 24x.
Embedded Expectations Analysis of Tiger Global paints a clear picture of the fund. The stocks it tracks exhibit strong earnings today. However, while the markets are pricing them in for further appreciation, analysts are expecting only a modest growth in profitability, which may send prices pressured even further in the future.
Even though markets are pricing Uniform ROA to grow to 26%, analysts are only forecasting returns to grow to 15% in the next two years.
In particular, there are a few names that are forecasted to see a reckoning that the market hasn’t yet priced in.
While Snowflake (SNOW) has achieved strong brand recognition among data users in recent years, analysts aren’t expecting them to become profitable just yet with a forecast of -4% Uniform ROA for 2024. Meanwhile, markets are projecting the company to not just improve their returns, but soar to 50% in the same period.
Ring Central (RNG) may similarly disappoint as the market is projecting their returns to inflect positively to 13% Uniform ROA, while analysts expect them to become even more unprofitable with a -4% Uniform ROA.
This just goes to show the importance of valuation in the investing process. Finding a company with strong growth is only half of the process. The other, just as important part, is attaching reasonable valuations to the companies and understanding which have upside which have not been fully priced into their current prices.
To see a list of companies that have great performance and stability also at attractive valuations, the Valens Conviction Long Idea List is the place to look. The conviction list is powered by the Valens database, which offers access to full Uniform Accounting metrics for thousands of companies.
Click here to get access.
Read on to see a detailed tearsheet of one of Tiger Global’s largest holdings.
SUMMARY and JD.com, Inc. Tearsheet
As Tiger Global’s largest individual stock holding, we’re highlighting JD.com’s (JD:USA) tearsheet today.
As the Uniform Accounting tearsheet for JD.com highlights, its Uniform P/E trades at 18.5x, which is below the global corporate average of 20.6x and its historical average of 45.8x.
Low P/Es require low EPS growth to sustain them. In the case of JD.com, the company has recently shown a Uniform EPS shrinkage of 42%.
Wall Street analysts provide stock and valuation recommendations that, in general, provide very poor guidance or insight. However, Wall Street analysts’ near-term earnings forecasts tend to have relevant information.
We take Wall Street forecasts for GAAP earnings and convert them to Uniform earnings forecasts. When we do this, JD.com’s Wall Street analyst-driven forecast is for EPS to grow by 157% and 56% in 2021 and 2022, respectively.
Based on the current stock market valuations, we can use earnings growth valuation metrics to back into the required growth rate to justify JD.com’s $51 stock price. These are often referred to as market embedded expectations.
The company is currently being valued as if Uniform earnings were to grow by 25% annually over the next three years. What Wall Street analysts expect for JD.com’s earnings growth is above what the current stock market valuation requires through 2022.
Meanwhile, the company’s earning power is in line with long-run corporate averages. However, cash flows and cash on hand are 6x the total obligations—including debt maturities and capex maintenance. Moreover, intrinsic credit risk is 60 bps. Together, these signal low operating and credit risks.
Lastly, JD.com’s Uniform earnings growth is above peer averages and is trading above its average peer valuations.
Best regards,
Joel Litman & Rob Spivey
Chief Investment Strategist &
Director of Research
at Valens Research
This portfolio analysis highlights the same insights we use to power our FA Alpha product. To find out more visit our website.