Today’s FA Alpha Daily will talk about Tiger Global and the upside potential of its technology dominant investment portfolio after the recent slide in valuations.
FA Alpha Daily:
Friday Portfolio Analysis
Powered by Valens Research
In recent years, we have seen a convergence of financial institutions and the roles they play as market makers.
With this shift, legacy financial institutions such as hedge funds and asset managers began to add to their traditional roles.
One of the most important lineages in the hedge fund industry is Tiger Global and all of its offspring. Those who worked for Julian Roberston at Tiger went on to create their own funds, becoming known as the “Tiger Cubs.” And those that emerged from Tiger Cub funds became known as “Tiger Grandcubs.” There are now trillions of dollars under management that can be linked back to Tiger Management.
Tiger Global and the other tiger cubs were at the forefront of turning hedge funds into late-stage venture capital funds. While hedge funds often take on different investing strategies, a huge swath of Tiger Global and other Tiger cubs’ funds are technology dominant investors.
Rather than focus on the late-stage venture capital that some of the first venture capital adopters took on, these Tiger funds invested in companies across the funding timeline, with a focus on technology.
With some irony as Robertson was known for his avoidance of technology investments during the dotcom buildup in the late 1990s, Tiger and its cubs took on a different tune during the 2010s. With the technology boom of the 2010s, it was a visionary strategy to be in technology and they were able to ride the wave to great wealth.
As we have talked about before with Tiger Global and Coatue, part of the things that Julian Robertson’s acolytes took with him was the hive mind approach. They believed that when someone had a strong thesis, everyone with conviction joined in.
By marrying good fundamental research on funding undervalued companies along with deep research on big trends that could affect those companies, the belief, and reality for the 2010s, was that they could make immense profits.
However, with the technology crunch of the past several months combined with the surge of commodity inflation, it appears that they have been caught in the wrong stocks at the wrong time.
Let’s take a look at this fund through our Uniform Accounting lens to see if Tiger Global is adjusting to the current environment, or if there is something worse afoot.
Economic productivity is massively misunderstood on Wall Street. This is reflected by the 130+ distortions in the Generally Accepted Accounting Principles (GAAP) that make as-reported results poor representations of real economic productivity.
These distortions include the poor capitalization of R&D, the use of goodwill and intangibles to inflate a company’s asset base, a poor understanding of one-off expense line items, as well as flawed acquisition accounting.
It is no surprise that once many of these distortions are accounted for, it becomes apparent which companies are in reality robustly profitable and which may not be as strong of an investment.
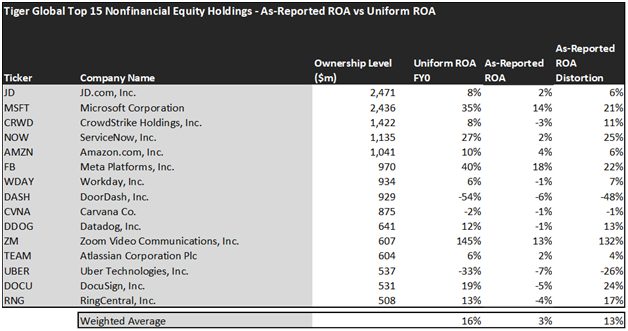
Contrary to what one might expect with the tech crunch of the past few months, most of Tiger Global’s largest holdings remain in a better position than you would expect.
The average as-reported ROA among Tiger Global’s top 15 names is a miniscule 3%, which doesn’t even beat the average cost of capital in the market. In reality, though, these companies perform much better, with a 16% Uniform ROA.
One of the fund’s largest holding Microsoft (MSFT), for example, doesn’t return an average 14%. It actually provides drastically stronger returns, at a 35% Uniform ROA which takes into account their large cash holdings that dilute their as reported ROA.
Some of his other investments are also much stronger than they appear. For example, ServiceNow (NOW) does not have 2% returns. Rather, as a company with strong tailwinds, it has a 27% Uniform ROA.
Largely, once we account for Uniform Accounting adjustments, we can see that many of these companies are strong technology stocks that are priced to grow at strong rates.
These dislocations demonstrate that most of these firms are in a different financial position than GAAP may make their books appear. But there is another crucial step in the search for alpha. Investors need to also find companies that are performing better than their valuations imply.
Valens has built a systematic process called Embedded Expectations Analysis to help investors get a sense of the future performance already baked into a company’s current stock price. Take a look:
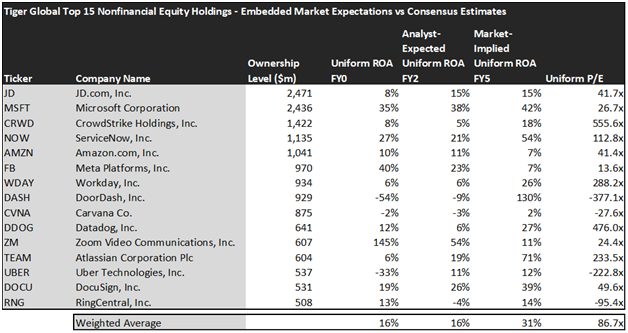
This chart shows four interesting data points:
- The Uniform ROA FY0 represents the company’s current return on assets, which is a crucial benchmark for contextualizing expectations.
- The analyst-expected Uniform ROA represents what ROA is forecasted to do over the next two years. To get the ROA value, we take consensus Wall Street estimates and we convert them to the Uniform Accounting framework.
- The market-implied Uniform ROA is what the market thinks Uniform ROA is going to be in the three years following the analyst expectations, which for most companies here is 2023, 2024, and 2025. Here, we show the sort of economic productivity a company needs to achieve to justify its current stock price.
- The Uniform P/E is our measure of how expensive a company is relative to its Uniform earnings. For reference, average Uniform P/E across the investing universe is roughly 24x.
Embedded Expectations Analysis of Tiger Global paints a clear picture of the fund. The stocks it tracks are strong, but more expensive than market expectations as they are already priced for growth.
The fund has analysts expecting average ROA to stay flat at 16%, while the market is pricing these companies to grow their economic profitability to 31%.
This is where a large holding could be setting investors up for disappointment. After years of underperforming, DoorDash (DASH) could be set to once again do the same as it is unlikely that they outperform market expectations of earning 130% returns with analyst expectations of -9%.
Furthermore, a company like RingCentral (RNG) might also disappoint with the market expecting them to increase ROA from 13% to 14% compared with analyst expectations of -4% which would mean significant downside.
This just goes to show the importance of valuation in the investing process. Finding a company with strong growth is only half of the process. The other, just as important part, is attaching reasonable valuations to the companies and understanding which have upside which have not been fully priced into their current prices.
To see a list of companies that have great performance also at attractive valuations, the Valens Conviction Long Idea List is the place to look. The conviction list is powered by the Valens database, which offers access to full Uniform Accounting metrics for thousands of companies.
Click here to get access.
Read on to see a detailed tearsheet of the largest holding in Tiger Global.
SUMMARY and JD.com, Inc. Tearsheet
As Tiger Global’s largest individual stock holdings, we’re highlighting JD.com, Inc.’s (JD:USA) tearsheet today.
As the Uniform Accounting tearsheet for JD.com, Inc. highlights, its Uniform P/E trades at 41.7x, which is above the global corporate average of 24.0x, but below its historical average of 51.6x.
High P/Es require high EPS growth to sustain them. In the case of JD, the company has recently shown a Uniform EPS decline of 42%.
Wall Street analysts provide stock and valuation recommendations that, in general, provide very poor guidance or insight. However, Wall Street analysts’ near-term earnings forecasts tend to have relevant information.
We take Wall Street forecasts for GAAP earnings and convert them to Uniform earnings forecasts. When we do this, JD’s Wall Street analyst-driven forecast is for a 5% EPS decline in 2021 and a 190% EPS growth in 2022.
Based on the current stock market valuations, we can use earnings growth valuation metrics to back into the required growth rate to justify JD’s $62 stock price. These are often referred to as market embedded expectations.
The company is currently being valued as if Uniform earnings were to grow by 37% over the next three years. What Wall Street analysts expect for JD’s earnings growth is below what the current stock market valuation requires in 2021, but above the requirement in 2022.
Meanwhile, the company’s earning power is near the long-run corporate averages and, cash flows and cash on hand are 5x its total obligations—including debt maturities and capex maintenance. Moreover, JD is 50bps above the risk-free rate. Together, these signal low operating and credit risks.
Lastly, JD’s Uniform earnings growth is below its peer averages, but is trading above average peer valuations.
Best regards,
Joel Litman & Rob Spivey
Chief Investment Strategist &
Director of Research
at Valens Research
This portfolio analysis highlights the same insights we use to power our FA Alpha product. To find out more visit our website.