
Harman’s Position In Connected Car Solutions Has Returns Revved Up
Summary:
- Harman International Industries (HAR) is trading near historical lows.
- Investor concerns about peaking automotive sales appear too pessimistic, and they appear to be overestimating the impact on HAR’s business.
- Considering building confidence around agreements to provide connected car solutions and about long-term increasing demand for connected car solutions, current low valuations and expectations appear too bearish.
Performance and Valuation Prime™ Chart
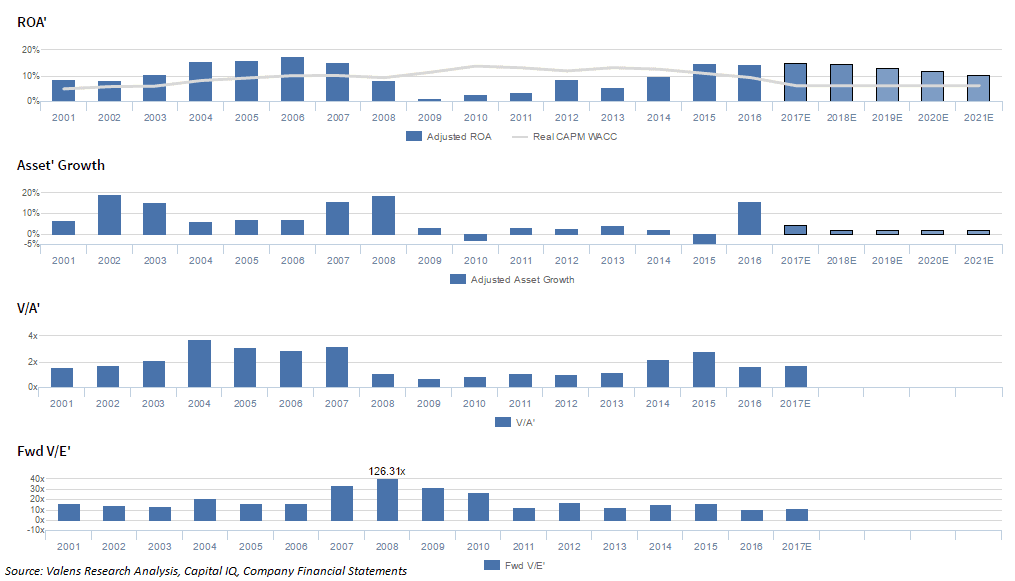
Historically, Harman International Ind. Inc. (NYSE:HAR) has seen cyclical profitability, with Adjusted ROA (ROA’) increasing from 8% in 2002 to a peak of 17% in 2006, before declining to a mere 1% in 2009. However, ROA’ slowly recovered to 15% in 2015, before slightly fading to 14% in 2016. Meanwhile, the firm aggressively grew their Adjusted Asset (Asset’) base annually by 6-19% from 2001-2008, as they continued to generate robust ROA’s. However, they have significantly slowed their spending since the Great Recession, with Asset’ growth ranging from -5% to 4% from 2009-2015, with 16% growth in 2016 attributable to the firm’s acquisition of TowerSec, an automotive cyber-security firm.
On an initial view, the company’s ROA’ clearly appears to be cyclical, with a cycle peak in 2004-2007 and a cycle trough in 2009-2011. With this pattern, ROA’ reaching similar peak levels currently and concerns about the demand cycle for their biggest end market, autos, investor concerns about ROA’ declining initially appear reasonable. However, several factors, including the company’s positioning to benefit from secular trends in their car and other end markets, and the potential duration of end market cycles, spell reasons to think market expectations may be too pessimistic.
The four panels explain the company’s historical corporate performance and valuation levels plus consensus estimates for forecast years as well as what the market is currently pricing in, in terms of expectations for profitability and growth.
The apostrophe after ROA’, Asset’, V/A’, and V/E’ is the symbol for “prime” which means “adjusted.” These calculations have been modified with comprehensive adjustments to remove as-reported earnings, asset, liability and cash flow statement inconsistencies and distortions. To better understand the PVP chart and the following discussion, please refer to our guide here.
Click here to read the article in its entirety at Seeking Alpha, where we discuss why we believe Harman has material equity upside potential despite potentially peak auto sales.


