
Investing legend Jack Bogle pioneered passive investing, this fund lets investors live by their timetable, as opposed to market timing

Many investors today do not have the time or resources to pick individual stocks to try and beat the market.
For these investors, getting exposure to a broader index eliminated the hassle of individual stock-picking or the fees associated with actively-managed funds. Many investors turn to this specific index fund to diversify their holdings and get exposure to the broad market.
In addition to examining the portfolio, we are including a deeper look into the fund’s largest current holding, providing you with the current Uniform Accounting Performance and Valuation Tearsheet for that company.
Investor Essentials Daily:
Friday Uniform Portfolio Analytics
Powered by Valens Research
The investing landscape has undergone a seismic shift over the past 30 years. While the actively managed mutual fund was once the undisputed holder of institutional funds, the average fund underperforms the market as a whole. In 2019, just 29% of funds beat their benchmarks after fees. The influx of capital into passive investing has proven it is more difficult than ever to find an edge and consistently beat the market.
Now, investors are focusing on gaining exposure to the broader market, not worrying about beating market returns. This is the difference between passive and active investing. Individual investors’ understanding of this shift can largely be traced back to one man; Jack Bogle.
Bogle is a legendary American investor, known for his time leading Vanguard. Bogle is credited with creating the first index fund, a staple in modern day investing. He first caught onto issues with actively managed funds well before he founded the firm.
His undergraduate thesis at Princeton in 1951 was about how actively managed funds underperformed the market as a whole. Walter Morgan, founder of investment giant Wellington, was so impressed with the thesis that he hired Bogle to work for him.
Bogle rose through the ranks to eventually become chairman at Wellington before being fired for what he describes as an “unwise merger”. Ironically, Vanguard’s inception can be traced to Wellington not wanting Bogle to do advisory work after leaving the firm. As a result, he created the world’s first index fund.
Bogle understood with the creation of Vanguard’s passive strategy it was not as important for individual investors to beat the market, contrary to conventional wisdom at the time. Rather, it was necessary for them to participate in the massive value creation of the stock market, regardless of beating a benchmark.
As Bogle once said, “The biggest risk facing investors is not short-term volatility but, rather, the risk of not earning a sufficient return on their capital as it accumulates.” Essentially, individual investors get too caught up in short-term fluctuations in the market, rather than letting capital accumulate over time.
This lines up with our Timetable Investor philosophy, which focuses on ensuring investors allocate the right percentage of their wealth between equities, bonds, and cash, depending on when they need to access the funds.
Bogle’s philosophy has been so successful, Vanguard is now one of the largest asset managers in the world along with BlackRock. It is only behind BlackRock because BlackRock, with its massive ETF business, has committed so deeply to the world of passive investing pioneered by Vanguard.
One of Vanguard’s biggest passive management strategies is the Institutional Index Fund-Institutional Plus Shares, meant to track the S&P 500. We have reviewed the S&P 500 before, but it is good to revisit periodically, especially with how volatile the market has been.
This week, we are looking at some of the top 15 companies in the S&P 500, which make up over 32% of the total index. Using as-reported metrics, it may appear as if these 15 firms have already reached maturity and are seeing weak returns due to their massive size.
However, these securities are actually much stronger names once Uniform Accounting metrics are applied.
See for yourself below…
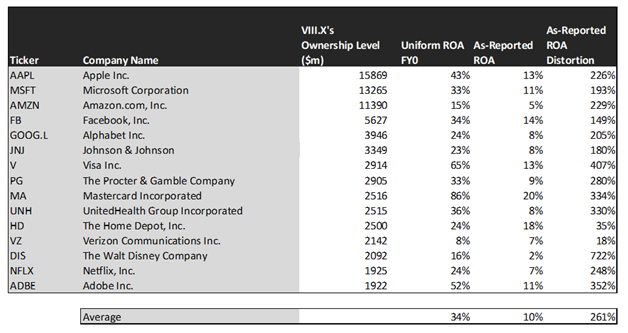
Using as-reported accounting, investors would think buying into the VIIIX fund would lead to losing out on investment potential.
On an as-reported basis, many of these companies are poor performers with returns at 9% or below, with the average as-reported return on assets (ROA) right around 10%.
In reality, the average company in the index displays an impressive average Uniform ROA of 34%.
Once we make Uniform Accounting (UAFRS) adjustments to accurately calculate earnings power, we can see the underlying strength of investing in the S&P 500.
Once the distortions from as-reported accounting are removed, we can see that Visa (V) does not have an average return of 13%, but a sizable ROA of 65%.
Similarly, Mastercard’s (MA) ROA is really 86%, not at 20%. While as-reported metrics are portraying the company as solidly above average, Uniform Accounting shows the company’s truly robust operations.
Disney (DIS) is another great example of as-reported metrics misrepresenting the company’s profitability. It doesn’t have a 2% ROA, it is actually at 16%.
The list goes on from there, for names ranging from Microsoft (MSFT) and Apple (AAPL), to Facebook (FB), Amazon (AMZN), and Adobe (ADBE).
If investors were to only look at as-reported metrics, they would assume passive investing means accepting exposure to companies with below-average returns. In reality, these large companies have huge returns to justify their valuations.
Now, let us see how these firms’ returns can strengthen over time through EPS growth.

This chart shows three interesting data points:
- The 2-year Uniform EPS growth represents what Uniform earnings growth is forecast to be over the next two years. The EPS number used is the value of when we take consensus Wall Street estimates and we convert them to the Uniform Accounting framework.
- The market expected Uniform EPS growth is what the market thinks Uniform earnings growth is going to be for the next two years. Here, we show by how much the company needs to grow Uniform earnings in the next 2 years to justify the current stock price of the company. If you’ve been reading our daily analyses and reports for a while, you’ll be familiar with the term embedded expectations. This is the market’s embedded expectations for Uniform earnings growth.
- The Uniform EPS growth spread is the spread between how much the company’s Uniform earnings could grow if the Uniform earnings estimates are right, and what the market expects Uniform earnings growth to be.
The average company in the U.S. is forecast to have 5% annual Uniform Accounting earnings growth over the next 2 years. On the other hand, these top 15 stocks are forecasted by analysts for 3% growth.
On average, the market is pricing these companies to grow earnings by 11% a year. This highlights that by buying these huge companies, you are often buying into firms that already have high market expectations.
However, that doesn’t mean there are not still interesting growth opportunities within the VIIIX.
One example of a company with high growth potential is Johnson & Johnson (JNJ). While the market expects Johnson & Johnson to shrink by 4% over the next two years, analysts forecast the firm to see a 6% growth over the same period.
Another company with similar dislocations is UnitedHealth Group (UNH). The company is forecast for Uniform EPS to grow by 11% a year, and the market is expecting the company to only grow EPS by 3%.
Yet another example is Verizon (VZ). The company is cheap, as it is priced to shrink Uniform earnings by 5%, but the company is forecast to in fact grow its EPS by 5% in the next two years.
That being said, there are some companies forecast to have earnings growth less than market expectations. For these companies, like Disney, Amazon, and Visa, the market has growth expectations in excess of analysts’ predictions.
In conclusion, passive investing has allowed many more investors to participate in the value creation of the stock market. Vanguard’s VIIIX fund provides an easy way for investors to track the S&P 500 with minimal fees. The largest companies in this fund possess high returns after we remove the as-reported distortions.
SUMMARY and Apple Inc. Tearsheet
As Vanguard Institutional Index Fund’s largest individual stock holding, we’re highlighting Apple’s tearsheet today.
As the Uniform Accounting tearsheet for Apple highlights, the Uniform P/E trades at 27.6x, which is above corporate average valuation levels and its historical average valuations.
High P/Es require high EPS growth to sustain them. In the case of Apple, the company has recently shown a 2% Uniform EPS growth.
Wall Street analysts provide stock and valuation recommendations that in general provide very poor guidance or insight. However, Wall Street analysts’ near-term earnings forecasts tend to have relevant information.
We take Wall Street forecasts for GAAP earnings and convert them to Uniform earnings forecasts. When we do this, Apple’s Wall Street analyst-driven forecast is a 73% shrinkage into 2020 and a 12% growth into 2021.
Based on current stock market valuations, we can use earnings growth valuation metrics to back into the required growth rate to justify Apple’s $112 stock price. These are often referred to as market embedded expectations.
The company needs to grow its Uniform earnings by 11% each year over the next three years and to justify current stock prices. What Wall Street analysts expect for Apple’s earnings growth is below what the current stock market valuation requires in 2020, but above what the market requires in 2021.
Furthermore, the company’s earning power is 7x the corporate average. Also, cash flows are 3x above their total obligations—including debt maturities, capex maintenance, and dividends. Together, this signals a low credit and dividend risk.
To conclude, Apple’s Uniform earnings growth is below peer averages in 2020. However, the company is trading above average peer valuations.
Best regards,
Joel Litman & Rob Spivey
Chief Investment Strategist &
Director of Research
at Valens Research


