
The Automation Wave is Real, But This Stock Doesn’t Have to Go Higher Because of It

Rockwell Automation (ROK) has had impressive Uniform Returns for the past 15 years, and in particular the past 8. Since 2011, Rockwell has consistently been able to produce Uniform ROA above 20% a year, year in, year out.
Rockwell has been able to produce such strong stable returns because they focus on offering solutions that have been at the heart of the modernization of manufacturing.
For the developed world’s factories to remain competitive, there has been a huge wave of investment in automation, and it’s focused around:
- designing and creating machines to do work that previously was done by people
- using software and technology to optimize processes, from prototyping and design to production and packaging
- leveraging the internet of things (IoT) to be able to monitor and optimize production and better help management connect production and needs
Rockwell helps in all three of those areas. Their core legacy focus was in the first part of this process–in designing and creating robots and machines to drive automation–but they have been investing in the other two areas aggressively to build out their core competency and own the world of automation.
In particular, to help build out their core competency in software for process optimization and IoT technology, they made a $1 billion investment into PTC Inc (PTC), formerly Parametric Technology, in 2018. The investment gave them an almost 10% stake in the company and a board seat, and closely aligned Rockwell and PTC for the future. Rockwell and PTC now bundle several offerings together.
PTC is a software manufacturer who’s software is ideally suited to pair with Rockwell’s core competency. Their software does everything from power IoT analytics in a factory to also enabling engineers to create augmented reality environments to understand products and process designs, to help customers manage product lifecycles and workflow. They are the software that powers the world of automation.
Their positioning in this space led to the stock almost tripling from early 2016 until mid 2018, around the time Rockwell made their investment. However since then, the stock has come under pressure.
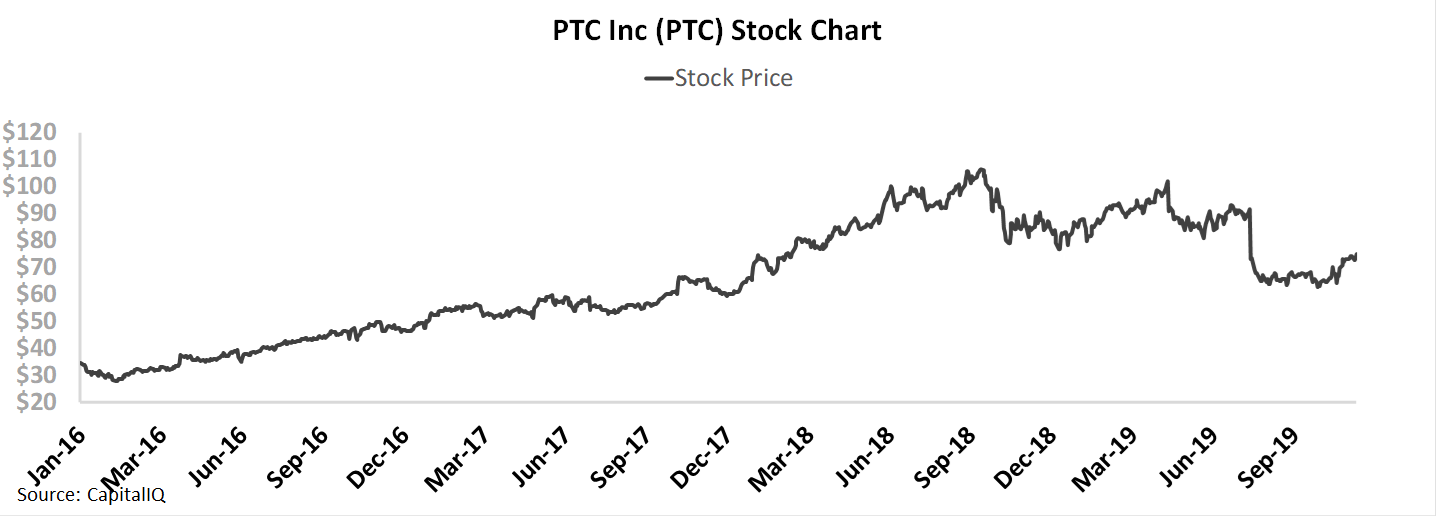
The reason the stock has been under pressure is that analysts have been steadily walking down their estimates for PTC’s revenue and earnings over the past 18 months, driven by management.
But the stock has also been under pressure because after the Rockwell investment, valuations for PTC had become incredibly high. Investors were pricing a massive inflection in PTC’s returns in the future, which did not look realistic even with Rockwell’s support.
Investors may think that, considering the long-term macro trends backing PTC and Rockwell, this is an opportunity to buy the dip, driven by overstated concerns about global growth and trade impacting manufacturing.
But PTC management is growing more concerned about their outlook for the company, in particular about market share trends, revenue growth, and overall guidance. These concerns point to continued headwinds for the company that could continue to put a cap on the stock price. And considering how high expectations still are, growing management pessimism may put pressure on the stock.
Market expectations are for record Uniform ROA, but management may be concerned about market share, revenue growth, and guidance
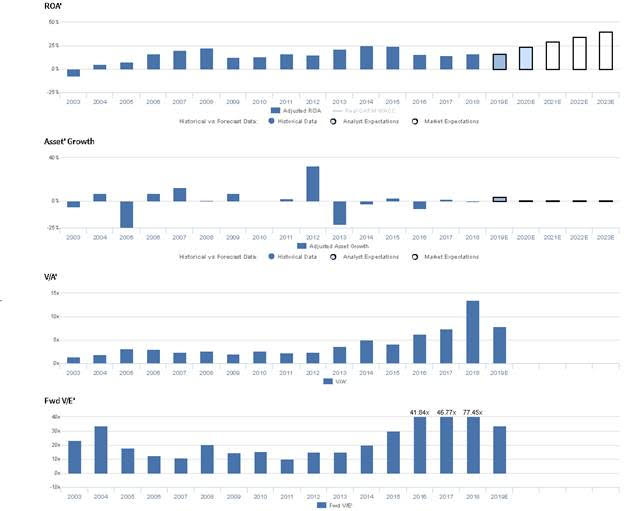
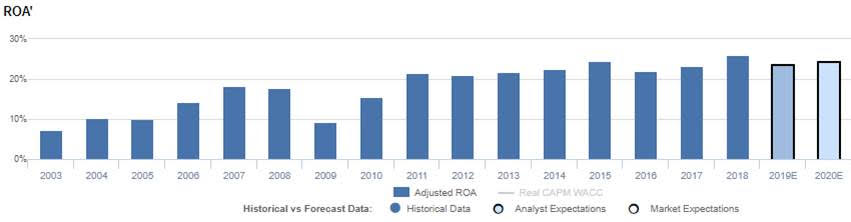
PTC currently trades well above corporate averages relative to UAFRS-based (Uniform) Earnings, with a 33.9x Uniform P/E. At these levels, the market is pricing in expectations for Uniform ROA to improve from 16% in 2018 to a record high of 40% in 2023, accompanied by 1% Uniform Asset growth.
Analysts have similar expectations, projecting Uniform ROA to improve to 24% through 2020, accompanied by 4% Uniform Asset growth.
PTC has historically seen cyclical, generally improving profitability. Uniform ROA expanded from -8% in 2003 to 23% in 2008, before fading to 12% in 2009, amidst recessionary headwinds. Thereafter, Uniform ROA rebounded to a peak of 25% in 2014, before declining to 15%-16% levels from 2016-2018. Meanwhile, Uniform Asset growth has been volatile, positive in just nine of the past 16 years, while ranging from -24% to 33%.
Performance Drivers – Sales, Margins, and Turns
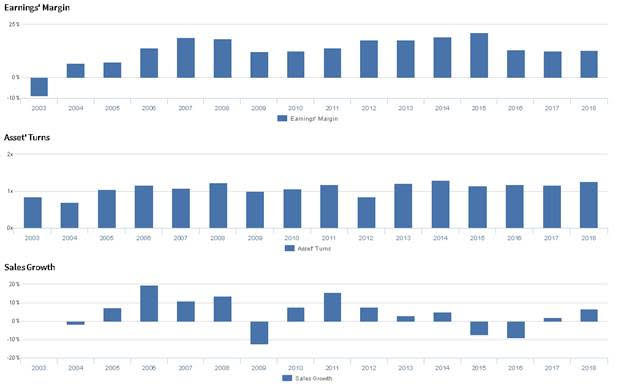
Cyclicality in Uniform ROA has been driven by trends in both Uniform Earnings Margin and Uniform Asset Turns. After expanding from -9% in 2003 to 19% in 2007, Uniform Margins declined to 12% in 2009, before rebounding to 21% in 2015. However, since then, Uniform Margins have faded to 12%-13% levels from 2016-2018. Meanwhile, Uniform Turns expanded from 0.9x in 2003 to 1.2x in 2008, before declining to 0.8x in 2012. Thereafter, Uniform Turns expanded to 1.2x-1.3x levels through 2018. At current valuations, markets are pricing in expectations for both Uniform Margins and Uniform Turns to expand to all-time highs.
Earnings Call Forensics
Valens’ qualitative analysis of the firm’s Q4 2019 earnings call highlights that management is confident they have a strong pipeline through FY 2020 and that they exceeded their Q4 guidance in bookings. However, they may be exaggerating the value of their strategic alliance with Rockwell Automation, and they may lack confidence in their ability to win further market share in the SaaS market. Furthermore, they may lack confidence in their ability to growth their IoT business, meet sales guidance, and sustain year-over-year revenue growth.
UAFRS VS As-Reported

Uniform Accounting metrics also highlight a significantly different fundamental picture for PTC than as-reported metrics reflect. As-reported metrics can lead investors to view a company to be dramatically stronger or weaker than real operating fundamentals highlight. Understanding where these distortions occur can help explain why market expectations for the company may be divergent.
As-reported metrics significantly understate PTC’s profitability. For example, as-reported ROA for PTC was 2% in 2018, substantially lower than Uniform ROA of 16%, making PTC appear to be a much weaker business than real economic metrics highlight. Moreover, since 2016, as-reported ROA has remained below cost-of-capital levels, at 1%-2%, while Uniform ROA has ranged above 15%, significantly distorting the market’s perception of the firm’s profitability floor.
Today’s Tearsheet
Today’s tearsheet is for Netflix. Netflix trades at a significant premium to market average valuations. The company has recently had massive Uniform EPS growth, at around 130%. EPS growth is forecast to moderate but stay well above corporate averages, dipping in 2019 to 22% before rising again in 2020 to 45%. At current valuations, the market is similarly pricing the company to have growth in line with 2019 levels going forward, but below 2020 forecasts.
The company’s earnings growth for 2019 is at the high end of peer average levels, but the company is also trading at above peer average valuations. The company has robust returns, and no cash flow risks.
Regards,
Joel Litman
Chief Investment Strategist


