
The Battle to be the Monte Carlo of the West

In the 1950s, Las Vegas’ position as the preeminent destination for gambling in the Americas wasn’t yet secure.
The mob and others had heavily invested in Vegas and business was booming, but there was a rival constantly threatening Vegas.
Most people now think of Cuba as Castro’s island, a communist bastion in the Caribbean 90 miles from the Florida Keys.
But as anyone who’s seen the Godfather Part II would know, before Castro’s uprising, Havana was a booming gambling destination.
It was Vegas’ rival as the Monte Carlo of the Western Hemisphere.
However, for most of Vegas’ casino owners, legitimate and otherwise, who won made no difference to them. Many, like the Las Vegas Desert Inn’s owners, and the Sands’ ownership, invested in both places. As long as gambling rose, they’d win.
In the end, Las Vegas won out, thanks to Castro’s intervention. Once his revolution succeeded, he put an end to Havana’s dream of unseating Vegas as the gambling mecca of the Americas.
While government intervention led to significant losses for the casino investors, the companies never forgot what they learned. It was better to be part of the action any time a rival to Vegas opened, instead of fighting it.
So in the 2000s, as Macau started to reduce their gambling regulations, in particular removing the monopoly they had granted previously on gambling, Vegas casino companies saw the opportunity and jumped in.
Wynn (WYNN), Galaxy, MGM Mirage (MGM), and others started to invest heavily in the massive opportunity that was a gambling destination on the shores of the most populous nation on earth.
The company that jumped in most heavily to the Monte Carlo of the Orient though was Las Vegas Sands (LVS).
They own the Sands Macao, the Plaza Macao, Sands Cotai Center, The Parisian Macao, and the largest casino in Macao, the Venetian Macao.
They invested so massively in Macao that the city state currently makes up over 60% of their operations.
This was great when Macao was growing, but now with concerns about China’s growth, the trade war, and intermittent crackdowns on money laundering through Macao, Las Vegas Sands’ exposure has been a headwind for the stock, especially over the past 2 years.
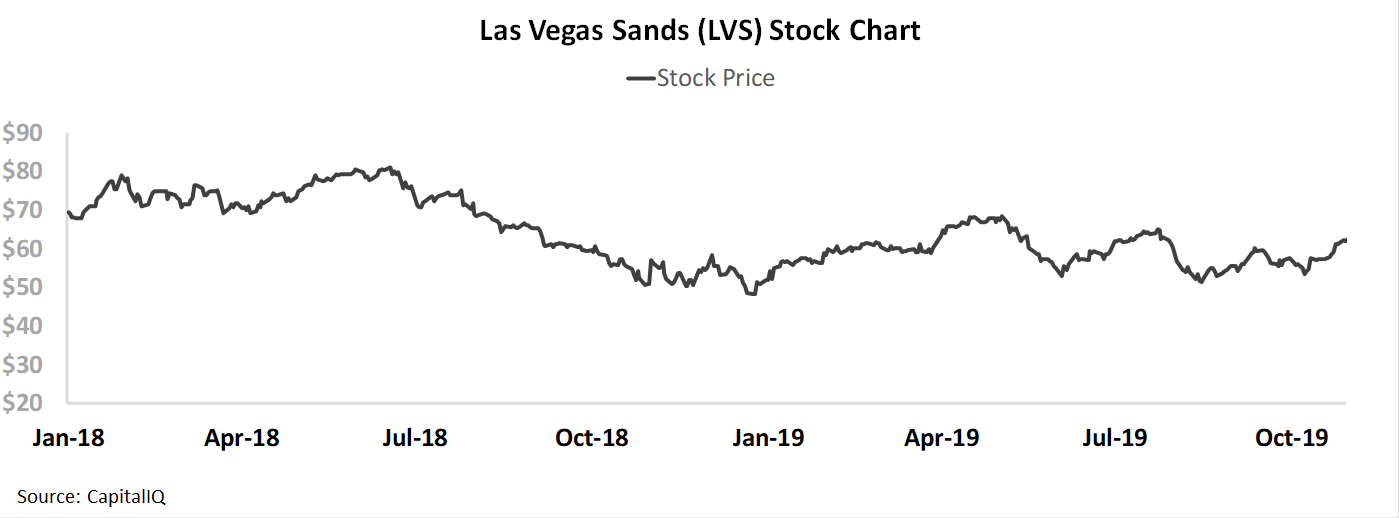
Now investors appear concerned about the company’s outlook for Macau, and their overall business. At the current stock price, the market is pricing in Las Vegas Sands to see returns to decay slightly going forward.With management confident about Macau and their overall outlook for the business, the market may be too pessimistic.
Join us for The Uniform Accounting Webinar this Friday
This Friday, we’ll be hosting a webinar highlighting the massive distortions that are inherent in as-reported accounting.
We’ll be drilling down on why as-reported accounting gets these 5 companies wrong:
Microsoft (MSFT)
Roku (ROKU)
Booking Holdings (BKNG)
Comcast (CMCS.A)
Discovery (DISCA)
And how, using Uniform Accounting, we can get better insights, understand what the market’s pricing in, and what the company could really be worth.
For example, we’ll be discussing why Roku’s EPS is really $1.00, not -$0.08,
We’ll also discuss how Comcast is more expensive than investors think, as its P/E is really 22x, not 14x.
To register for the webinar, click here.
Market expectations are for Uniform ROA to decline, but management is confident about growth, profitability, and Macao

LVS currently trades below corporate averages relative to UAFRS-based (Uniform) Earnings, with an 18.6x Uniform P/E. At these levels, the market is pricing in expectations for Uniform ROA to decline from 18% in 2018 to 16% in 2023, accompanied by immaterial Uniform Asset growth going forward.
Meanwhile, analysts have similar expectations, projecting Uniform ROA to fall slightly to 17% levels through 2020, accompanied by 1% Uniform Asset growth.
Historically, LVS has seen cyclical profitability. Uniform ROA improved from 7% in 2003 to 17% in 2005. Subsequently, Uniform ROA collapsed to -1% by 2009, before expanding to 22% in 2014, declining to 13% in 2016, and improving to 18% in 2018. Meanwhile, from 2003 to 2012, Uniform Asset growth was robust, ranging from 10% to 75%. However, since then, Uniform Asset growth has been muted, ranging from 0% to 2% since 2013.
Performance Drivers – Sales, Margins, and Turns
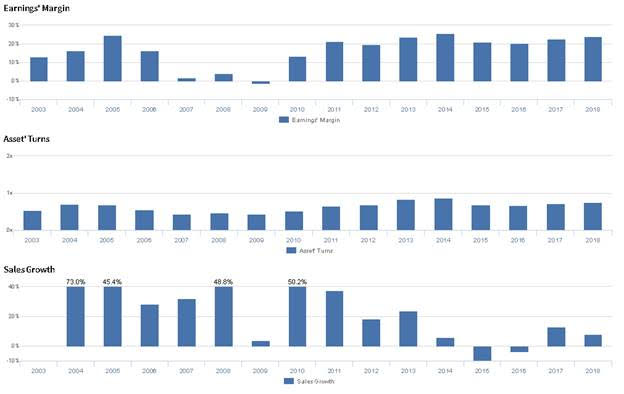
Uniform ROA has been driven by cyclical Uniform Earnings Margin with compounding trends in Uniform Asset Turns. Uniform Margins improved from 13% to 25% from 2003 to 2005, before collapsing to -1% to 4% levels from 2007 to 2009. Then, Uniform Margins improved to 26% in 2014, fell to 20% in 2016, and rose back to 24% in 2018. Meanwhile, Uniform Turns improved from 0.5x in 2003 to 0.7x levels in 2004-2005, before sliding to 0.4x in 2009. Thereafter, Uniform Asset Turns improved to 0.9x in 2014, and sustained 0.7x-0.8x levels from 2015 to 2018. At current valuations, markets are pricing in expectations for a reversal of recent improvements to Uniform Margins and Uniform Turns.
Earnings Call Forensics
Valens’s qualitative analysis of the firm’s Q2 2019 earnings call highlights that management is confident they invested in Macao before competitors and their previous resorts have seen consistent growth. Furthermore, they are confident that Macao customers drive profitability through their betting trends, and they are confident there are other market opportunities to offset headwinds related to slowdowns in the junket industry.
However, management may be concerned about the value of their recent Londoner and Four Seasons construction, and they may lack confidence in their ability to realize market share growth through suite construction. Furthermore, they may be downplaying concerns about the sustainability of their Las Vegas baccarat business, and they may lack confidence in their ability to sustain recent EBITDA levels from their Las Vegas business. Finally, they may lack confidence in their ability meet their growth guidance for 2019, effectively allocate capital, and drive investment in Japan.
UAFRS VS As-Reported
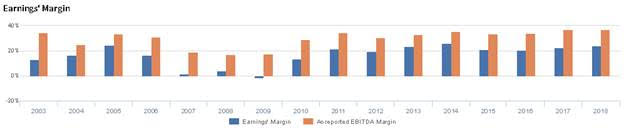
Uniform Accounting metrics also highlight a significantly different fundamental picture for LVS than as-reported metrics reflect. As-reported metrics can lead investors to view a company to be dramatically stronger or weaker than real operating fundamentals highlight. Understanding where these distortions occur can help explain why market expectations for the company may be divergent.
As-reported metrics significantly overstate LVS’s Earnings Margin, a key driver of profitability. For example, as-reported EBITDA margin for LVS was 37% in 2018, materially higher than Uniform Earnings Margin of 24%, making LVS appear to be a much more profitable business than real economic metrics highlight. Moreover, as-reported EBTIDA margin has greater than Uniform Earnings Margin for the past sixteen years, distorting the market’s perception of LVS’s margin levels and trends.
Today’s Tearsheet
Today’s tearsheet is for Boeing. Boeing trades around market average valuations. The company has historically had strong Uniform EPS growth, and after forecast massive decline in EPS in 2019, this is expected to continue in 2020. At current valuations, the market is expecting the company to actually have no significant earnings growth going forward. The company’s earnings growth is below peer average levels, but the company is trading at peer average valuations. The company has strong profitability, and no risk to their dividend yield.
Regards,
Joel Litman
Chief Investment Strategist


