
This company has expanded its reach across the globe, but at a historically high 31x P/E, its success may not be enough to quench investors’ thirst

As a leader in its space, this firm has been able to yield phenomenal returns by expanding its reach to as many places as possible.
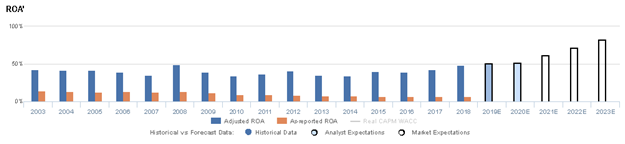
While as-reported ROA looks fairly pedestrian for the name, TRUE UAFRS-based (Uniform) analysis shows that, as a result of its strategy, this company has been able to produce consistently robust profitability.
However, management appears concerned about manufacturing capex, developing market and organic revenue growth, and their zero-sugar products. This suggests market expectations may be too high, and lofty valuations may not be justified.
Also below, Uniform Accounting Embedded Expectations Analysis and the Uniform Accounting Performance and Valuation Tearsheet for the company
Investor Essentials Daily:
Thursday Tearsheet & Embedded Expectations
Powered by Valens Research
Sergio Zyman, a former marketing executive at both Coca-Cola and Pepsi, once stated that “the sole purpose of marketing is to sell more to more people, more often, and at higher prices.”
This simple philosophy about marketing has certainly been put to use by his former employer.
No, not Pepsi, we covered that company last week.
We’re talking about The Coca-Cola Company (KO), which has been a marketing giant throughout its history.
Its advertisements have been iconic throughout many generations.
From its “Share a Coke” campaign to its World Cup features to its polar bear Christmas features, Coca-Cola’s vast array of advertising campaigns and marketing channels has helped it remain a household name.
Coca-Cola advertisements are seemingly everywhere.
From billboards to Super Bowl commercials to viral videos and more, the company and its iconic brands keep finding new ways to be front-and-center.
Although its marketing may be impressive, what matters more for Coca-Cola, and what has made it so wildly successful, is that it focuses on the purpose behind the marketing.
As Zyman alluded to, it sells more to more people and more often.
Like its advertisements, Coca-Cola products are everywhere.
Its reach is unmatched among other soft drink companies, and potentially, any other company on the planet. Coca-Cola is currently sold in all but two countries in the world, Cuba and North Korea. Both of these have long-term US trade embargoes.
Not only is Coca-Cola present in almost every geography, but it has also entered into every major channel.
Coca-Cola can be found at virtually any convenience store or supermarket.
It is available at sport stadiums and concert venues, and its vending machines can be found in innumerable places, from malls to popular tourist locations to run-down gas stations.
The firm has also secured long-term partnerships with many major restaurants and fast-food chains, including rival burger joints such as McDonald’s, Burger King, and Wendy’s.
Consumers feel like they can order a “Coke” everywhere, and restaurant patrons may often be taken aback if a server responds “Is a Pepsi OK?”
Coca-Cola’s global reach has allowed it to sell to more people, and its presence in virtually every beverage-selling location has allowed it to sell more often.
Although the firm may have built its empire by extending its flagship brand, it has lived by Zyman’s mantra for as many of its products as possible.
Diet Coke and Sprite have easily followed the same channels as the original Coca-Cola.
As the company has extended itself into waters & hydration, with Dasani and Powerade, and juices, with Minute Maid, its expansion strategy has been apparent… never be out of reach.
Soon enough, its new lines of coffees and teas will become ubiquitous, as well.
Although Coca-Cola has remained a powerful global brand and has yielded phenomenal return on assets, investors using as-reported metrics may be misled to believe that its strategy has faltered in recent years.
Return on assets (ROA) have declined from peak 13%-14% levels in 2003-2006 to near corporate average levels of 7% in 2015-2018.
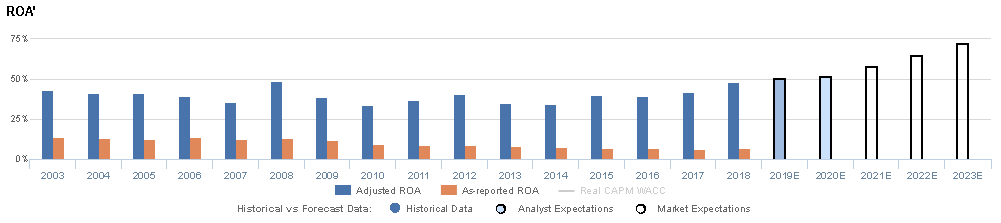
However, Uniform Accounting indicates that as-reported metrics are understating Coca-Cola’s profitability and shows how the strength of its brands and global reach has enabled it to have robust returns, with a Uniform ROA above 34% in each year since 2003.
In addition, contrary to as-reported ROA trends, Uniform ROA has expanded from a trough of 34% in 2010 to near-peak 48% levels in 2018.
Investors appear to recognize Coca-Cola’s strength and that as-reported metrics are artificially distorting the company’s performance, as the firm currently trades at a premium Uniform P/E of 30.7x.
At the current stock price, the market expects Coca-Cola to see Uniform ROA rise from 48% in 2018 to an all-time high of 73% in 2023, accompanied by steady 4% Uniform Asset growth.
Considering the company’s strong performance, expecting returns to persist might make sense. But expecting a consumer staples company with remarkably stable returns to see profitability take off like a rocket ship appears unreasonable.
On top of this, management appears to be concerned about manufacturing capex, developing market and organic revenue growth, and their zero-sugar products. With expectations so high, management cannot have any missteps.
It may be difficult for the firm to meet exceptionally high market expectations and justify lofty valuations going forward, even with its strong brand strategy.
Coca-Cola Embedded Expectations Analysis – Markets have bullish expectations for KO, but management may be concerned about capex, growth, and their zero-sugar products

KO currently trades above corporate averages relative to UAFRS-based (Uniform) Earnings, with a 30.7x Uniform P/E.
At these levels, the market is pricing in expectations for Uniform ROA to nearly double, from 48% in 2018 to record-high 73% levels in 2023, accompanied by 4% Uniform Asset growth.
Meanwhile, analysts have less bullish expectations, projecting Uniform ROA to expand to just 52% by 2020, accompanied by 4% Uniform Asset growth.
Historically, KO has seen relatively stable, robust profitability.
From 2003-2007, Uniform ROA ranged between 35%-43%, before peaking at 49% in 2008, and subsequently stabilizing at 34%-41% levels through 2016. Since then, Uniform ROA has expanded to current 48% levels in 2018.
Meanwhile, Uniform Asset growth has historically been volatile, positive in eight of the past 16 years, but negative in each of the past five, while ranging from -24% to 21% since 2003, with the former driven by the divestiture of many bottling and distribution assets in 2017.
Performance Drivers – Sales, Margins, and Turns
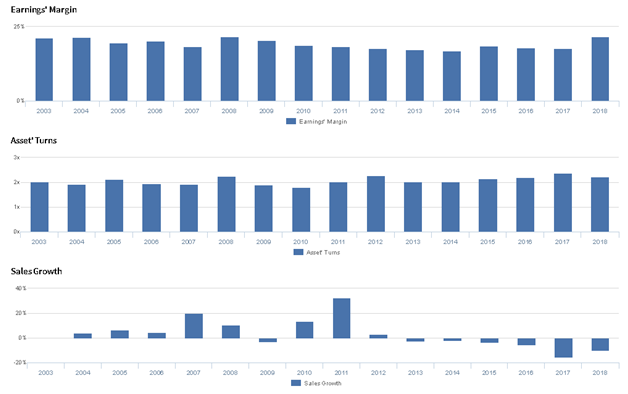
Stability in Uniform ROA has been driven by offsetting trends in Uniform Earnings Margin and Uniform Asset Turns.
Uniform Margins declined from 22% in 2004 to 18% in 2007, before rebounding to 22% in 2008. Then, Uniform Margins gradually declined to 17%-19% in 2010-2017, but have since expanded to 22% in 2018.
Meanwhile, Uniform Turns ranged between 1.9x-2.1x from 2003-2007, before improving to 2.3x in 2008. Then, despite falling to a low of 1.8x in 2010, Uniform Turns expanded to a peak of 2.4x in 2017, before fading to 2.2x in 2018.
At current valuations, markets are pricing in expectations for both Uniform Margins and Uniform Turns to expand to new record highs.
Earnings Call Forensics
Valens’ qualitative analysis of the firm’s Q3 2019 earnings call highlights that management is confident they have improved recycling in the U.K.
However, management is also confident they will need to spend capex on manufacturing if mini-cans increase in popularity, and they may lack confidence in their ability to sustain growth in developing markets.
Furthermore, they may be concerned about the profitability of their zero-sugar offerings, and they may lack confidence in their ability to sustain organic revenue growth.
UAFRS VS As-Reported
Uniform Accounting metrics also highlight a significantly different fundamental picture for KO than as-reported metrics reflect.
As-reported metrics can lead investors to view a company to be dramatically stronger or weaker than real operating fundamentals highlight.
Understanding where these distortions occur can help explain why market expectations for the company may be divergent.
As-reported metrics significantly understate KO’s profitability.
For example, as-reported ROA for KO was 7% in 2018, more than 6x lower than Uniform ROA of 48%, making KO appear to be a much weaker business than real economic metrics highlight.
Moreover, since 2006, as-reported ROA has halved, fading from 14% to current 7% levels, while Uniform ROA has expanded from 40% to 48% over the same period, directionally distorting the market’s perception of the firm’s historical profitability trends.
SUMMARY and Coca-Cola Tearsheet
As our Uniform Accounting tearsheet for The Coca-Cola Company (KO) highlights, Coca-Cola trades at a 30.7x Uniform P/E, which is well above corporate averages and historical levels for the company.
High P/E levels require high EPS growth to sustain valuations. Recently, Coca-Cola has only been able to grow its Uniform EPS by 11%.
Wall Street analysts provide stock and valuation recommendations that in general provide very poor guidance or insight. However, Wall Street analysts’ near-term earnings forecasts tend to have relevant information.
As such, we use Wall Street GAAP earnings estimates as a starting point for our Uniform earnings forecasts. When we do this, we can see that Coca-Cola is forecast to see Uniform EPS growth of 13% in 2019, followed by 8% growth in 2020.
Based on current stock market valuations, we can use earnings growth valuation metrics to back into the required growth rate to justify Coca-Cola’s $54 stock price. These are often referred to as market embedded expectations.
In order to justify current stock prices, the company would need to have Uniform earnings grow by a moderate 9% each year over the next three years.
Wall Street analyst earnings growth expectations are somewhat volatile over the next two years, but ultimately, they generally fall in-line with the earnings growth rates required to justify current valuations.
With its high valuations, Coca-Cola’s Uniform P/E is among the highest in its peer group, while its Uniform EPS growth is also well above peer averages.
Meanwhile, the company’s earning power is 8x corporate averages, and as a result of its strong cash flows and sizable cash buffer, both credit risk and dividend risk remain low.
To summarize, Coca-Cola is a company with high earning power, with equally high embedded expectations, and it must sustain its historical earnings growth to justify current valuations.
Best regards,
Joel Litman & Rob Spivey
Chief Investment Strategist &
Director of Research
at Valens Research


