
This investor’s big bets have both made and almost broke his investing career, Uniform Accounting shows which bucket his current bets will fall under

This fund manager has lived by a less known Buffett quote about being a concentrated investor when you have all the information. It has both made him billions and almost sunk his career multiple times.
His focus on big bets, an activist strategy, and an understanding of real estate have all been key contributions to his investing success.
But using GAAP as-reported financial metrics, the investments in his fund’s portfolio look like someone made some significant mistakes in their process.
In reality, UAFRS-based financial metrics show how this fund manager is buying stocks with very attractive upside signals.
In addition to examining the portfolio, we’re including a deeper look into the fund’s largest current holding, providing you with the current Uniform Accounting Performance and Valuation Tearsheet for that company.
Investor Essentials Daily:
Friday Uniform Portfolio Analytics
Powered by Valens Research
Warren Buffett is such a famous investor mostly because of how incredibly successful he has been. But his quotability has not hurt in increasing his reputation and Q-score.
One of Buffett’s less-often highlighted quotes goes a long way towards describing the investment philosophy of the investor and fund we’re highlighting today:
“Diversification may preserve wealth, but concentration builds wealth.”
If there have been three tenets that have defined how Bill Ackman has run Pershing Square Capital, that would be one of the most important.
The other two tenets of Ackman’s most successful investments have tended to be a focus on companies that had real estate-related exposure and a commitment to activism.
Ackman’s focus on real estate shouldn’t come as too much of a surprise, as his family has a long-running history in the real estate business. His grandfather founded a real estate investment and development firm in the 1920s. His father took over the firm in the 1960s where he helped the firm focus on other aspects of real estate financing.
There is something to be said for sticking to what you know. Often Ackman’s least successful investments, such as Valeant or Herbalife, have been when he ventured away from investments that had some real estate component.
On the other hand, some of his greatest successes, such as his short bet on MBIA ahead of the financial crisis, and his successful investment in General Growth Properties in the midst of the Great Recession, has been thanks to his real estate acumen.
Ackman has also been an activist investor for some time. As opposed to other activists, who some might call “green mailers,” who seek to create stress for management in an effort to get them to either sell the company or buy back the activist’s stake, Ackman has regularly taken a more long-term activism approach.
His goal has generally been to enact change in a company that is long-lasting, yielding significant stock appreciation when it has had success.
Great examples of this were his proxy battle with Canadian Pacific Railway, which led to Hunter Harrison taking over the firm and enacting massive changes that improved operations. This led to the stock price almost tripling from his announcement until the stock peaked during his tenure in 2015.
But even among activists, Ackman’s choice in being exceptionally concentrated is an outlier.
Currently, Pershing Square has only 10 holdings. Chipotle was almost 20% of the fund’s holdings as of the form 4 the company filed on February 7th. Hilton Worldwide is 16% of the fund’s total capital, for context.
For context, Third Point, a fund run by activist Dan Loeb, owns 45 different equity positions. Carl Icahn’s Icahn Enterprises owns hundreds of stocks.
This extreme concentration is a signal of high conviction in Pershing Square’s investments. It is also a signal that Ackman’s goal is not wealth preservation, but maximum wealth accumulation for himself and his investors.
That concentration has been remarkably rewarding when Ackman has been right. The company’s investments in Canadian Pacific and General Growth Properties are just two examples of investments that earned over $1 billion for its investors.
When he hasn’t succeeded, it has led to multi-billion dollar losses for investors. Pershing Square lost $500 million in its failed JC Penney investment, as much as $4.6 billion on its Valeant Pharmaceuticals investment, and a significant amount on the firm’s Herbalife short.
Considering Pershing Square’s highly focused investment strategy, one would expect that Ackman and his team are turning over every rock to make sure they know a company completely.
When looking at the fund’s holdings using as-reported metrics, investors might think Pershing Square is buying some very poor performing turnaround candidates in the hopes activism will drive a turnaround.
But in reality, Uniform Accounting analytics highlight that Ackman is often targeting companies with already strong profitability. These are companies where he doesn’t have to worry about their economic moats being disrupted, but he thinks he can unlock greater value.
We’ve conducted a portfolio audit of Pershing Square’s top holdings, based on their most recent 13-F, focusing on its non-financial company holdings.
We’re showing a summarized and abbreviated analysis of how we work with institutional investors to analyze their portfolios.
Unsurprisingly, for the most part, Pershing Square’s analytics appear to be steering the portfolio to companies that Uniform Accounting metrics highlight are much higher quality and have higher potential than the market and as-reported metrics imply.
Because Uniform Accounting metrics do a better job of identifying real corporate performance than as-reported distorted metrics do, UAFRS lines up better with the deep fundamental analysis Ackman and the Pershing Square team are doing.
See for yourself below.

Using as-reported accounting, investors would be questioning Ackman’s willingness to take such massive bets on the companies Pershing Square owns.
The average company in the portfolio displays an impressive average Uniform return on assets (ROA) at 32%. That’s well above current corporate average profitability. However on an as-reported basis, several of these companies are poor performers with ROAs below 10%. The average as-reported ROA is only 7%.
On an as-reported financial metric basis, it would appear that Pershing Square would need to be an excellent activist fund and completely turnaround companies that were very weak profitability firms.
However, once we make Uniform Accounting (UAFRS) adjustments to accurately calculate earning power, we can see that the ROAs of the companies in Pershing Square’s portfolio are much more robust.
In fact, looking at the companies that Ackman is buying on a Uniform basis, it’s clear he is betting on higher quality companies that he can unlock more value in, as opposed to solely turnarounds.
Once the distortions from as-reported accounting are removed, we can realize that Hilton Worldwide (HLT) doesn’t have a 7% ROA, it is actually at 80%. Hilton is an asset-light hotel operator that reaps significant benefits from its franchisees’ growth. `
Similarly, Restaurant Brands’ (QSR) ROA is really 89%, not 6%. It appears Ackman just can’t quit Tim Hortons, which Restaurant Brands acquired in 2014, after Ackman built a sizable stake. He must love Canadian breakfast sandwiches and enjoy strong earning power franchising powerhouses.
Starbucks (SBUX) is another great example of as-reported metrics mis-representing the company’s profitability.
Starbucks doesn’t have an 11% ROA, it is actually at 28%. Pershing Square sees Starbucks strong profitability and growth strategy, and is betting on the company continuing to unlock value.
If Pershing Square’s research was powered by as-reported metrics, the fund would never pick most of these companies because they look like bad companies and poor investments.
But to find companies that can deliver alpha beyond the market, just finding companies where as-reported metrics misrepresent a company’s real profitability, is insufficient.
To really generate alpha, any investor also needs to identify where the market is significantly undervaluing the company’s potential.
Pershing Square is also investing in companies where the market is mispricing growth, with market expectations low enough for the companies to exceed based on their strong fundamentals.
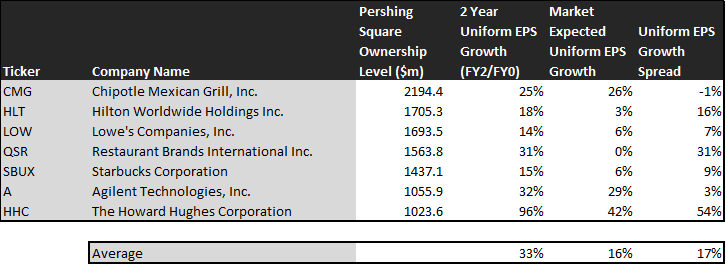
This chart shows three interesting data points:
– The first datapoint is what Uniform earnings growth is forecast to be over the next two years, when we take consensus Wall Street estimates and we convert them to the Uniform Accounting
framework. This represents the Uniform earnings growth the company is likely to have, the next two years
– The second datapoint is what the market thinks Uniform earnings growth is going to be for the next two years. Here, we are showing how much the company needs to grow Uniform earnings by in the next 2 years to justify the current stock price of the company. If you’ve been reading our daily and our reports for a while, you’ll be familiar with the term embedded expectations. This is the market’s embedded expectations for Uniform earnings growth
– The final datapoint is the spread between how much the company’s Uniform earnings could grow if the Uniform Accounting adjusted earnings estimates are right, and what the market expects Uniform earnings growth to be
The average company in the US is forecast to have 5% annual Uniform Accounting earnings growth over the next 2 years. Pershing Square’s holdings are forecast by analysts to outpace that, growing at a robust 33% a year the next 2 years, on average.
Pershing Square is not just finding high quality companies, it is finding mispriced companies.
On average, the market is pricing these companies to grow earnings by 16% a year. While that signals high market expectations, these companies are growing even more robustly. They are intrinsically undervalued, as the market is mispricing their growth by 17% on average.
Even when looking at median levels, the market is mispricing these companies earnings growth by 18%.
These are the kinds of companies that are likely to see their stocks rally when the market realizes how wrong it is. Without Uniform numbers, the GAAP numbers would leave everyone confused.
One example of a company in the Pershing Square portfolio that has growth potential that the market is mispricing is Howard Hughes Corporation (HHC). Howard Hughes’ analyst forecasts have 96% Uniform earnings growth built in.
The market expects health growth, pricing the company to have earnings grow by 42% earnings each year for the next two years, but even that understates how strong the company could grow.
Another company with similar dislocations is Restaurant Brands (QSR), that we mentioned earlier. Expectations are modest, with market expectations for no growth in earnings going forward. However the company is actually forecast for Uniform EPS to grow by 31% a year. While the market doesn’t think the company can grow, if it can deliver even some of its forecast growth, there’s significant upside.
Only one name in Ackman’s portfolio appears to not be significantly undervalued.
Chipotle (CMG) is forecast to see Uniform earnings grow by 25% a year going forward, and the market is pricing the company for 26% annual earnings growth.
After the stock rallied from roughly $600 in early 2019 to over $900 this year, the market appears to be correctly understanding the company’s potential.
Pershing Square appears to recognize this too, as it has been steadily exiting Chipotle the last few quarters, and just updated its 13-D in early February, highlighting incremental selling.
But for the most part, Pershing Square’s portfolio looks like a high quality, undervalued set of stocks with businesses displaying strong earning power and opportunity for activism to accelerate this.
It wouldn’t be clear under GAAP but unsurprisingly Uniform Accounting and a system built to deliver alpha see the same signals.
SUMMARY and Chipotle Mexican Grill, Inc. Limited Tearsheet
As Pershing Square Capital Management’s largest individual stock holding, we’re highlighting Chipotle Mexican Grill’s tearsheet today.
As our Uniform Accounting tearsheet for Chipotle Mexican Grill, Inc. (CMG) highlights, CMG’s Uniform P/E trades at 48.7x, above corporate average valuation levels and its own recent history.
High P/Es require high EPS growth to sustain them. In the case of CMG, the company recently had an average 15% Uniform EPS growth.
While Wall Street stock recommendations and valuations poorly track reality, Wall Street analysts have a strong grasp on near-term financial forecasts like revenue and earnings. As such, we use Wall Street GAAP earnings estimates as a starting point for our Uniform Earnings forecasts. When we do this, we can see that CMG is forecast to only see Uniform EPS growth of 11% in 2019 followed by 39% in 2020.
Based on current stock market valuations, we can back into the required earnings growth rate that would justify $823 per share. These are often referred to as market embedded expectations. In order to meet the current market valuation levels of CMG, the company would have to have 26% Uniform EPS growth each year over the next three years.
What Wall Street analysts expect for CMG’s earnings growth is far above than what the current stock market valuation requires.
To conclude, CMG’s Uniform earnings growth is in line with peer averages in 2019. Also, the company is trading above peer valuations.
The company’s earnings power is 2x corporate averages, signaling that there is very low cash flow risk to the company’s operations and credit profile in the future.
Best regards,
Joel Litman & Rob Spivey
Chief Investment Strategist &
Director of Research
at Valens Research


