
Wishing you a happy Thanksgiving, or Franksgiving if you’d prefer

When most people think of our most influential presidents, three that immediately come to mind are Washington, Lincoln, and FDR. These three men played massive roles in framing the America we are in today.
They also played an important role in framing the most American of holidays, Thanksgiving.
Most who know trivial facts about history would tell you that Abraham Lincoln was the president who declared Thanksgiving a holiday, but that is actually not entirely true.
The first national Thanksgiving celebration was legally declared by the Continental Congress in 1777, following the victory at Saratoga. In 1789, George Washington was the first president to proclaim Thanksgiving a holiday. He chose November 26th as the day.
Lincoln was the first to mandate exactly when Thanksgiving would happen, stating Thanksgiving would always fall on the last Thursday of November. At this point Thanksgiving began to take hold as a national holiday, hence the confusion as to when Thanksgiving was first recognized.
That was good enough precedent for subsequent presidents for over 75 years. But in 1939, FDR decided to move Thanksgiving up one week. Thanksgiving would happen on the second-to-last Thursday of November.
It’s not the first time, nor was it the last, that a Republican (Lincoln), and a Democrat (FDR) had an argument over Thanksgiving…
His hope was adding an extra week to the Christmas season would help fuel retail sales in the midst of the Great Depression. The majority of Americans rebelled against the decision, coining it Franksgiving, but Roosevelt persisted the next year also.
However, after the Commerce Department found almost no change in retail sales because of the change, he finally acquiesced, and things returned to normal. Thanksgiving now always falls on the fourth Thursday in November.
With a strong economy, favorable credit fundamentals, and strong corporate profitability, it doesn’t appear we needed to be moving up Thanksgiving this year, which is good, because this year it is on November 28th, the latest day that Thanksgiving can fall on based on how the calendar works.
As you enjoy your Thanksgiving with whoever it is you are enjoying it with, old friends, family, on your own, with colleagues, with new friends or in any other situation, we at Valens wish you a truly happy Thanksgiving.
And feel free to break out this story when your uncle and cousin start arguing about politics over dinner or midway through the Bills v Cowboys game on Thursday. Remind them that political arguments on Thanksgiving are apparently as American as pumpkin pie, football, and cranberry sauce from a can.
Market expectations are for slight declines in Uniform ROA, but management is confident about their brand awareness, cost savings, and momentum

The Goodyear Tire & Rubber Company (GT) currently trades near recent lows relative to UAFRS-based (Uniform) Assets, with a 0.6x Uniform P/B. At these levels, the market is pricing in expectations for Uniform ROA to marginally decline from 4% in 2018 to 3% in 2023, accompanied by immaterial Uniform Asset shrinkage.
Meanwhile, analysts have muted expectations, projecting Uniform ROA to sustain 4% levels through 2020, accompanied by 3% Uniform Asset shrinkage.
Historically, GT has seen cyclical, but generally improving profitability. After the turn of the century, the firm saw Uniform ROA improve slightly, from 0% in 2003 to 4% in 2005, before inflecting negatively in 2009. That said, since the recession, GT has reached new levels of profitability, through major initiatives focused on improving operational efficiency. Specifically, Uniform ROA steadily expanded to 6% levels from 2013 through 2016, before declining to 4% in 2018. Meanwhile, Uniform Asset growth has been limited, positive in just nine of the past 16 years, while ranging from -9% to 9%.
Performance Drivers – Sales, Margins, and Turns
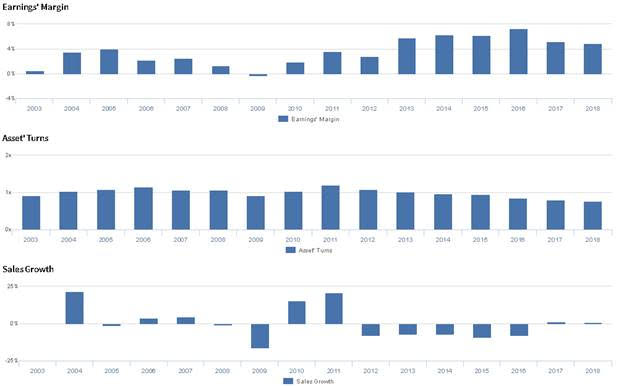
Trends in Uniform ROA have been driven by generally improving trends in Uniform Earnings Margin, offset slightly by declining trends in Uniform Asset Turns. From 2003-2005, Uniform Margins improved from 1% to 4%, before compressing to negative levels in 2009, and recovering to a peak of 7% in 2016. However, since then, Uniform Margins have declined to current 5% levels in 2018. Meanwhile, Uniform Turns improved from 0.9x in 2003 to 1.1x in 2005-2008, before declining back to 0.9x in 2009, and rebounding to a high of 1.2x in 2011. Since then, Uniform Turns have steadily declined to a low of 0.8x in 2018. At current valuations, markets are pricing in expectations for both Uniform Margins and Uniform Turns to decline slightly.
Earnings Call Forensics
Valens’ qualitative analysis of the firm’s Q3 2019 earnings call highlights that management is confident they are encouraged by their performance in Q3 and that their brand awareness is at an all-time high. Furthermore, they are confident in their ability to realize $60 million to $70 million in cost savings from upgrading factories and that they are well positioned to weather a downturn.
However, management may be overstating the value customers realize from their products over competitors, and they may lack confidence in their ability to sustain growth in the Americas and Asia Pacific. Furthermore, they may be concerned about further contraction of their market share in Europe, and they may be downplaying the negative impact of volume reductions on their operating income.
UAFRS VS As-Reported
Uniform Accounting metrics also highlight a significantly different fundamental picture for GT than as-reported metrics reflect. As-reported metrics can lead investors to view a company to be dramatically stronger or weaker than real operating fundamentals highlight. Understanding where these distortions occur can help explain why market expectations for the company may be divergent.
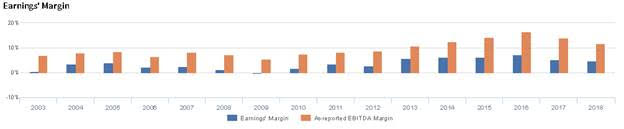
As-reported metrics significantly overstate GT’s margins. For example, as-reported EBITDA margin for GT was 12% in 2018, substantially higher than Uniform Margin of 5%, making GT appear to be a much stronger business than real economic metrics highlight. Moreover, as-reported margins have been at least twice as high as Uniform Margins in nearly every year since 2003, misleading investors to believe GT has a significantly higher margin ceiling than is accurate.
Today’s Tearsheet
Today’s tearsheet is for Nike. Nike trades at a significant premium to market average valuations. The company has recently had no Uniform EPS growth, but EPS growth is forecast to accelerate significantly going forward. At current valuations, the market is similarly pricing in the company having accelerating earnings growth going forward. The company’s earnings growth for 2019 is above peer average levels, but the company is trading at a premium to peer average valuations. The company has strong returns, with no risk to their dividend.
Regards,
Joel Litman
Chief Investment Strategist


