
Academics say all acquisitions destroy value, Uniform Accounting shows whether this company’s acquisition strategy bucks that trend

This company made a huge acquisition to expand its business and improve their operations. As-reported metrics saw this as a failure that destroyed the company’s value, hurting their returns.
Uniform Accounting paints a very different picture.
Also below, Uniform Accounting Embedded Expectations Analysis and the Uniform Accounting Performance and Valuation Tearsheet for the company.
Investor Essentials Daily:
Tuesday Tearsheets
Powered by Valens Research
Depending on what academic business research you read, be it from Bain or in the Harvard Business Review, the data agrees on one important point: acquisitions almost always destroy value.
Specifically, the statistics say between 70%-90% of acquisitions are a net negative for the acquirer.
Acquisitions bring about massive challenges for a company. These can include combining corporate cultures, finding and executing on revenue synergies, integrating different organizations and departments, and everything else involved in bringing together two businesses and finding the savings that investors demand to warrant an acquisition.
The challenges that acquisitions bring is the reason why many investors get concerned when a company pursues M&A. Sure, acquisitions have the potential to add significant value when done right, but the academic research shows it is so rare that it is done right. Why risk it?
Those concerns about acquisitions are especially true in commodity businesses, where there isn’t a lot of savings to be found anyway. So it wasn’t a surprise in 2016 when investors were spooked when Ball Corporation (BLL) made a massive acquisition, acquiring UK competitor Rexam for $9 billion.
Ball is the world’s largest manufacturer of beverage and food containers. Their products include the iconic mason jars used to preserve food (and has become a trendy way to consume beverages). They also offer cans, cups, and bottles.
Ball Corporation is also a packaging service that provides companies with the means to store and distribute food, beverage, and aerosol products.
Those do not sound like highly value-add businesses. If anything, they sound like generic commodity businesses where anyone would struggle to create significant value. But Ball wasn’t just trying to execute on their operations by acquiring Rexam. They took on significant incremental operational risk, and that could lead them to lose their attention on operations, and could actually hurt the business.
Based on as-reported metrics, as soon as the company undertook the transaction, it appeared they had exactly those issues. Return on assets (ROA) dropped from 6% in 2015 to 4% in 2016, and hasn’t recovered since.
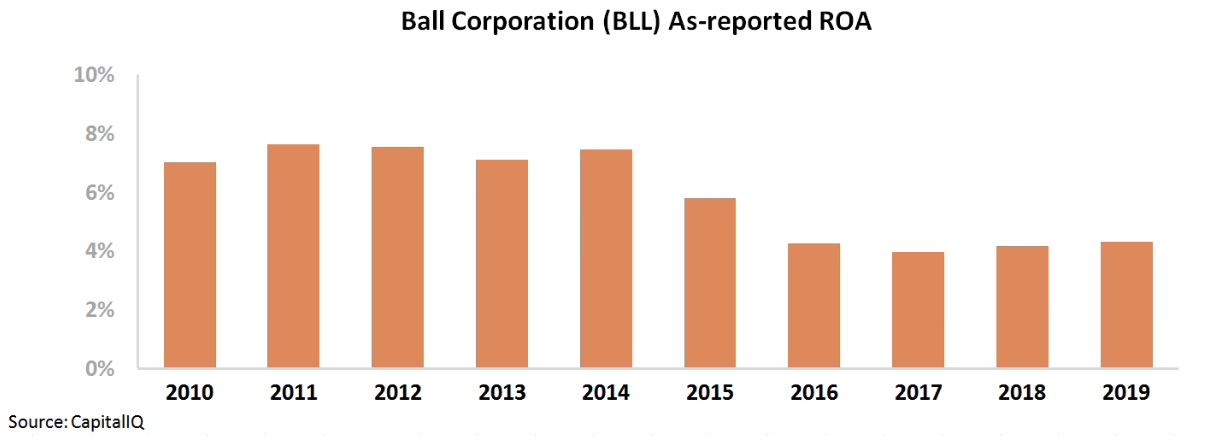
Based on this analysis, it looks like Ball is the poster child for the problems with companies pursuing acquisitions to drive growth. Companies struggle to add value when they make acquisitions.
However, Ball Corporation’s shares have been up by more than 100% since the acquisition happened.
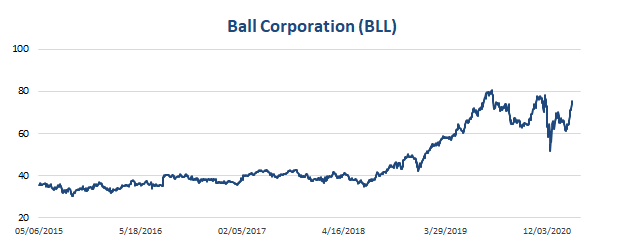
What is the market missing?
On a closer look, it looks like the market isn’t missing anything. It’s the as-reported GAAP-based metrics that are misunderstanding what has happened. In reality, the company has been generating impressive improvement in returns since 2016.
Based on Uniform Accounting metrics, returns have been at its highest compared to previous periods. Ball Uniform ROA was at 10% in 2015, but by 2016, ROA had risen to 15%, and it peaked at 20% in 2017.

The Rexam acquisition did transform Ball, but in a very different way than the as-reported accounting showed. Since the acquisition, profitability has improved and the market is recognizing it.
When analyzing acquisitions, while the data may say that they mostly destroy value, it’s still important to review them on a case-by-case basis. It appears Ball did right in this one.
Right now, the market appears to be pricing that momentum to continue going forward, and management believes so too, explaining why investors remain so bullish on the name.
Ball Corporation Embedded Expectations Analysis – Market expectations are for Uniform ROA to expand to new peaks, and management is confident about their investments, aluminum cups, and industry trends
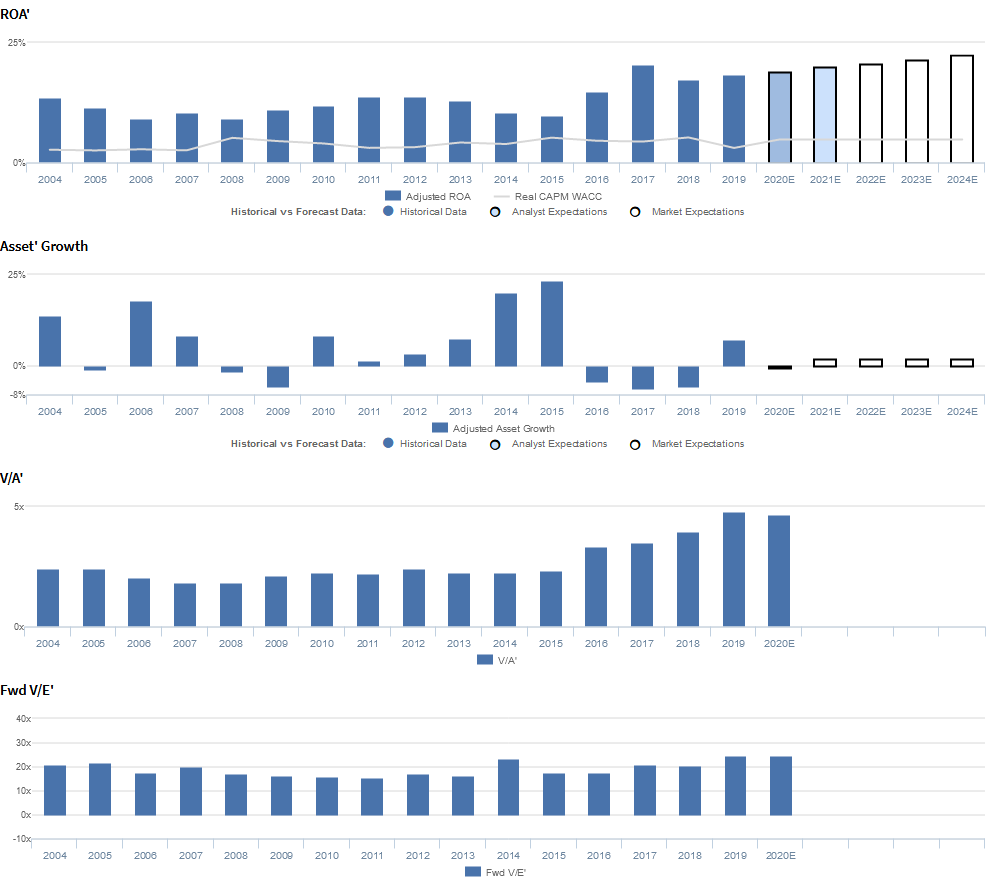
BLL currently trades above historical averages relative to Uniform earnings, with a 24.6x Uniform P/E (Fwd V/E′). At these levels, the market is pricing in expectations for Uniform ROA to expand from 18% in 2019 to a new peak of 23% in 2024, accompanied by 2% Uniform asset growth going forward.
Analysts have similar expectations, projecting Uniform ROA to improve to 20% in 2021, accompanied by immaterial Uniform asset shrinkage.
Historically, BLL has seen cyclical profitability trends, with Uniform ROA declining from 13% in 2004 to 9% in 2008, before rebounding to 14% in 2012, and fading to 10% in 2015. Following its 2015 acquisition of Rexam, a leading manufacturer of beverage cans, Uniform ROA expanded to new heights, reaching peak 17%-18% levels in 2017-2019.
Meanwhile, Uniform asset growth has been volatile, positive in ten of the past sixteen years, while ranging from -6% to 23%, with the latter driven by the aforementioned merger.
Performance Drivers – Sales, Margins, and Turns
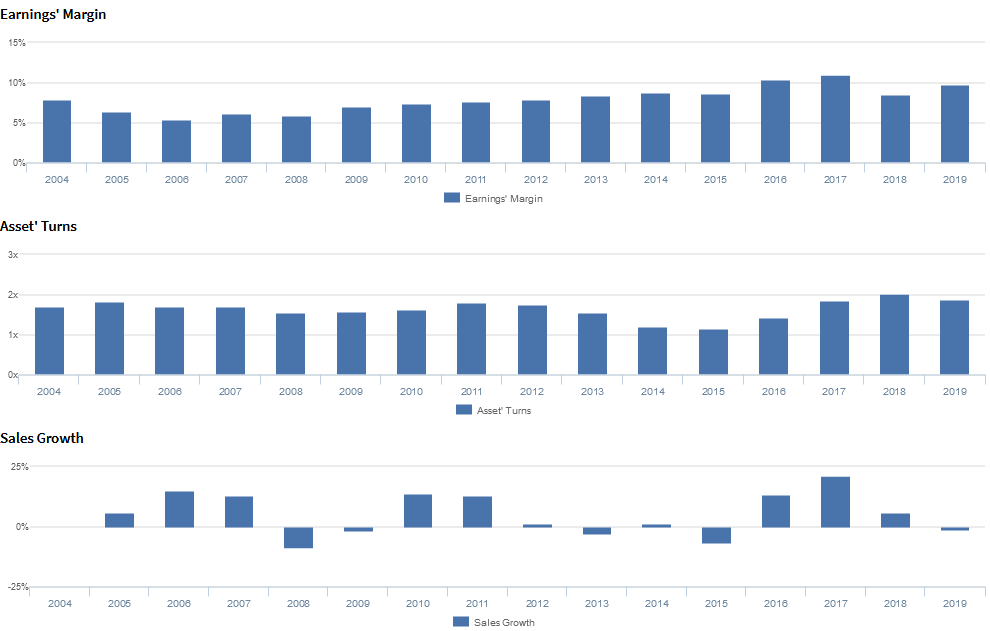
Cyclicality in Uniform ROA has been driven by somewhat cyclical, yet generally improving Uniform earnings margin, and relatively volatile Uniform asset turns.
After declining from 8% in 2004 to 5% in 2006, Uniform margins expanded to peak 9%-10% levels in 2014-2019.
Meanwhile, after ranging from 1.6x-1.8x from 2004 through 2012, Uniform turns compressed to a trough of 1.1x in 2015, before recovering to 1.9x-2.0x levels in 2018-2019.
At current valuations, the market is pricing in expectations for both Uniform margins and Uniform turns to expand to new peaks.
Earnings Call Forensics
Valens qualitative analysis of the firm’s Q3 2019 earnings call highlights that management is confident their focus is on maximizing the value and performance of their investments, they had strong volume in South America, and that on-premise providers will increase the recycling of their aluminum cups as receptacles are in place.
Moreover, they are confident about their ongoing rollout of their aluminum cups across colleges and universities and that they will get more costs in line following the completion of their recent investments. Furthermore, they are confident more customers are looking to move products from plastics and substrates to aluminum and that they had unplanned double-digit growth in specialty cans.
However, management is also confident their North and Central American segment felt the impact of US aluminum scrap headwinds, and they may be exaggerating their long-term growth prospects and the sustainability of growth rates. In addition, they may be concerned about projected declines in free cash flow, the launch of new product lines, and the progress of contract negotiations.
Finally, management may lack confidence in their ability to properly pace spending to align with customer needs, build enough operating capacity, and sustain their dividends and share buyback activity.
UAFRS VS As-Reported

Uniform Accounting metrics also highlight a significantly different fundamental picture for BLL than as-reported metrics reflect.
As-reported metrics can lead investors to view a company to be dramatically stronger or weaker than real operating fundamentals highlight.
Understanding where these distortions occur can help explain why market expectations for the company may be divergent.
As-reported metrics significantly understate BLL’s profitability.
For example, as-reported ROA for BLL was just 4% in 2019, substantially lower than Uniform ROA of 18%, making BLL appear to be a much weaker business than real economic metrics highlight.
Moreover, since the firm’s acquisition of Rexam in 2015, as-reported ROA has fallen from 6% to historical lows, while Uniform ROA has actually expanded from 10% to peak levels, misleading investors to believe the merger was detrimental to the company’s performance, when the opposite is true.
SUMMARY and Ball Corporation Tearsheet
As the Uniform Accounting tearsheet for Ball Corporation (BLL) highlights, it trades at a 24.6x Uniform P/E, which is above the corporate average valuations and its historical average valuations.
Low P/Es require low EPS growth to sustain them. In the case of Ball Corporation, the company has recently shown a 24% Uniform EPS growth.
Wall Street analysts provide stock and valuation recommendations that in general provide very poor guidance or insight. However, Wall Street analysts’ near-term earnings forecasts tend to have relevant information.
We take Wall Street forecasts for GAAP earnings and convert them to Uniform earnings forecasts. When we do this, Ball Corporation’s Wall Street analyst-driven forecast is for Uniform EPS growth of 9% in 2020, followed by 12% growth in 2021.
Based on current stock market valuations, we can back into the required earnings growth rate that would justify $64 per share. These are often referred to as market embedded expectations.
In order to meet current market valuation levels, Ball Corporation would have to have Uniform earnings growth of 6% each year over the next three years.
What Wall Street analysts expect for Ball Corporation’s earnings growth is above what the current stock market valuation requires.
Meanwhile, the company’s earnings power is 3x corporate averages, and their robust cash flows and cash on hand signal that there is low risk to the company’s operations and credit profile.
To conclude, Ball Corporation’s Uniform earnings growth is above peer averages, and the company’s price to earnings is trading in line with peer average valuations.
Best regards,
Joel Litman & Rob Spivey
Chief Investment Strategist &
Director of Research
at Valens Research


