
As-reported metrics make this company’s content data look like a commodity, UAFRS shows the unbiased truth just like the company’s ratings

Today’s company has helped an entire sub-industry monetize their assets. When it publishes its data, everyone pays attention. Bad results could mean the cancellation of your favorite TV show.
Investors may be puzzled why its valuable data has failed to generate substantial as-reported returns. Like this company’s data, Uniform Accounting shows the unskewed reality of its performance.
Also below, Uniform Accounting Embedded Expectations Analysis and the Uniform Accounting Performance and Valuation Tearsheet for the company.
Investor Essentials Daily:
Thursday Tearsheets
Powered by Valens Research
Nikola Tesla had an innovative solution for distributing power when the industry was still in its infancy. His solution was to harness radiant energy to transmit wireless power over great distances through the air. This would not only reduce our energy consumption from fossil fuels and gasoline, but the world would have had free electricity usage.
Perhaps unfortunate for the ecosystem and mankind, the innovation was not realized since creating the infrastructure would require significant funding. JP Morgan (the man, not the bank) had initially backed this venture, though he withdrew his support because there was no way to monetize this innovation. JP Morgan would not have been able to get his money back from this project.
Not all great ideas have worth in the eyes of investors hence why it would still be a challenge even today to realize Tesla’s idea. Each piece of electric equipment would need to have a “tollage” tool attached. JP Morgan would soon pull the plug on the project before seeing its completion.
Another industry with wide exposure was able to dodge the issue Tesla faced in its infancy, but eventually had to struggle with the same issues Tesla and JP Morgan faced.
When the media industry first emerged, it had a way to track its viewership. Newspaper companies could easily bill and measure their customer base through subscriptions and newsstand sales.
That changed with the emergence of TV, when media faced its Tesla moment.
For the larger broadcast TV market, measuring viewership was challenging. While there was a footprint of “eyeballs” that could be watching a channel, the problem was advertisers weren’t sure what channel consumers were or weren’t watching.
With TV networks not knowing for sure which shows were popular, they overpaid for the licensing fees of underperforming shows. Advertisers couldn’t be sure they were getting a bang for their buck, making selling ads more challenging.
So someone came along to solve the Tesla “tollage” problem…Nielsen Holdings plc (NLSN) rose to prominence.
In its early days, Nielsen founder Arthur Nielsen, Sr. invented a way to track television habits that later would help give the entity leverage.
As a third party ratings provider, they have developed a reputation of providing credible viewership numbers. Their ratings have become the go-to source for advertisers when retrieving demographic information and for networks when deciding about extending or pulling a show off the air.
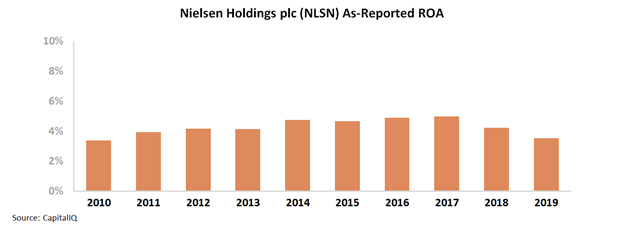
One would expect that Nielsen’s data and data collection capabilities would make the firm tremendously valuable, but as-reported metrics indicate that the data it offers isn’t worth much to its clients.
Over the past decade, the firm has struggled to generate economic value. As-reported ROA has been ranging below cost-of-capital levels and has gradually faded in recent years. Nielsen’s clients don’t appear to feel the need to pay a premium for what one might expect to be essential data for them.
In reality, Nielsen’s data has been offering tremendous value. Uniform Accounting shows that once accounting noise is removed, it is apparent that clients place tremendous value in Nielsen’s data, and are willing to pay up for it.
Though down from historical peak, Uniform ROA has maintained robust levels above 20%. As-reported metrics have materially understated the firm’s performance.

With market valuations forecasting Uniform ROA to fall to a historical low, the market is expecting Nielsen’s relevance in the media industry to decline alongside cable television’s viewership.
Rapidly growing streaming platforms such as Netflix, Amazon Prime Video, and Disney+ are spearheading the efforts of transitioning movies and shows to digital. They are spelling the end of the Golden Age of Television.
However, the resistance of the streaming platforms to advertisements continue to make television the preferred medium of choice for advertisers.
Even if these platforms do open to ads similar to what Amazon Prime Video has done, the need for unskewed third-party viewership results will persist. And that means those predicting Nielsen to follow Tesla’s distributed power solution into the garbage bin of history may be disappointed.
Nielsen Holdings plc Embedded Expectations Analysis – Market expectations are for continued Uniform ROA declines, and management may be concerned about growth, products, and markets
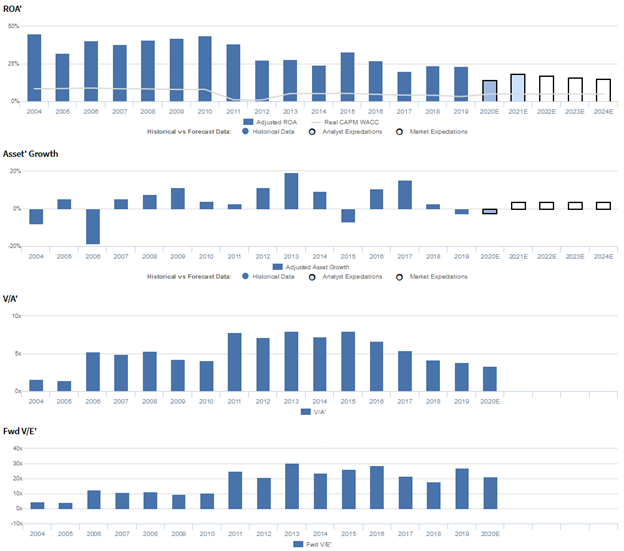
NLSN currently trades near corporate averages relative to Uniform earnings, with a 21.7x Uniform P/E (Fwd V/E’).
At these levels, the market is pricing in expectations for Uniform ROA to decline from 23% in 2019 to 15% in 2024, accompanied by 4% Uniform asset growth.
Meanwhile, analysts have similar expectations, projecting Uniform ROA to fade to 18% in 2021, accompanied by 2% Uniform asset shrinkage.
As a provider of measurement and data analytics, NLSN has historically seen robust, but generally declining profitability as data competition has increased.
After fading from 45% in 2004 to 32% in 2005, Uniform ROA recovered to 44% in 2010, following the firm’s acquisition by a consortium of private equity firms in 2006.
Subsequently, Uniform ROA dropped to 24% in 2014, and after a brief jump to 33% in 2015, has fallen to 20%-24% levels since 2017. Meanwhile, Uniform asset growth has been volatile, positive in twelve of the past sixteen years, while ranging from -19% to 19%.
Performance Drivers – Sales, Margins, and Turns
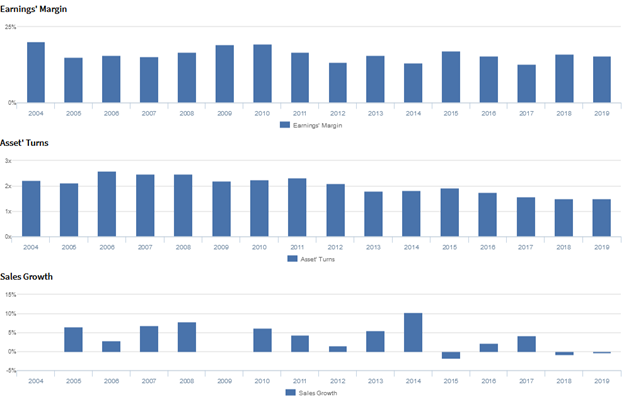
Cyclicality in Uniform ROA has been driven by cyclicality in Uniform earnings margins, while overall declines have been driven by weakness in Uniform asset turns.
Uniform margins have oscillated between 16%-17% highs and 13% lows, currently sitting at 15% in 2019.
Meanwhile, after jumping from 2.1x-2.2x levels in 2004-2005 to 2.6x in 2006, Uniform turns have since faded to 1.5x levels in 2018-2019.
At current valuations, markets are pricing in expectations for declines in both Uniform margins and Uniform turns.
Earnings Call Forensics
Valens’ qualitative analysis of the firm’s Q4 2019 earnings call highlights that management is confident their 2019 results reflect tremendous operational focus by Nielsen leadership and their global colleagues, and that they are working to rationalize their cost structures so that they are appropriately scaled for each business.
However, management may be concerned about reduced capex spending, the progress of their business separation, and increased media competition.
Moreover, they may lack confidence in their ability to sustain Measure segment revenue growth and EBITDA margin expansion, meet Media revenue CAGR expectations, and cater their account plans to meet customer needs.
In addition, management may have concerns about their TV contract renewals, their new product offerings in Plan/Optimize, and the progress of the Nielsen Connect platform deployment.
Furthermore, they may be exaggerating their role in local markets, the strength of their pricing power, and their ability to assist innovation clients.
UAFRS VS As-Reported

Uniform Accounting metrics also highlight a significantly different fundamental picture for NLSN than as-reported metrics reflect.
As-reported metrics can lead investors to view a company to be dramatically stronger or weaker than real operating fundamentals highlight. Understanding where these distortions occur can help explain why market expectations for the company may be divergent.
As-reported metrics significantly understate NLSN’s asset efficiency, a key driver of profitability. As-reported asset turnover for NLSN was 0.5x in 2019, materially lower than Uniform asset turns of 1.5x, making NLSN appear to be a significantly weaker business than real economic metrics highlight.
Moreover, as-reported asset turnover has been slowly expanding since 2006 from 0.3x to 0.5x, whereas Uniform asset turns have been steadily trending downward from 2.6x to 1.5x over the same time period, directionally distorting the market’s perception of the firm’s historical asset efficiency trend.
SUMMARY and Nielsen Holdings plc Tearsheet
As the Uniform Accounting tearsheet for Nielsen Holdings plc (NLSN:USA) highlights, the Uniform P/E trades at 21.7x, which is around corporate average valuation levels and its own recent history.
Average P/Es require average EPS growth to sustain them. In the case of Nielsen, the company has recently shown a 7% Uniform EPS shrinkage.
Wall Street analysts provide stock and valuation recommendations that in general provide very poor guidance or insight. However, Wall Street analysts’ near-term earnings forecasts tend to have relevant information.
We take Wall Street forecasts for GAAP earnings and convert them to Uniform earnings forecasts. When we do this, Nielsen’s Wall Street analyst-driven forecast is a shrinkage of 66% in 2020, followed by a growth of 120% in 2021.
Based on current stock market valuations, we can use earnings growth valuation metrics to back into the required growth rate to justify NLSN’s $15 stock price. These are often referred to as market embedded expectations.
The company can have Uniform earnings shrink by 7% each year over the next three years and still be able to justify current prices. What Wall Street analysts expect for Nielsen’s earnings growth is below what the current stock market valuation requires in 2020 but above that requirement in 2021.
Furthermore, the company’s earning power is 4x the corporate average. Also, cash flows are significantly lower than its total obligations—including debt maturities, capex maintenance, and dividends. Together, this signals high credit and dividend risk.
To conclude, Nielsen’s Uniform earnings growth is below peer averages. Therefore, as is warranted, the company is trading below peer average valuations.
Best regards,
Joel Litman & Rob Spivey
Chief Investment Strategist &
Director of Research
at Valens Research


