
Uniform Accounting shows this company has been able to find success with the help of one of Thomas Edison’s inventions

This lighting company appears to be a boring, cost-of-capital business when viewed through the lens of as-reported accounting.
However, UAFRS (Uniform) based analysis shows the firm’s real performance, with the market missing the profitability of the firm.
Also below, Uniform Accounting Embedded Expectations Analysis and the Uniform Accounting Performance and Valuation Tearsheet for the company.
Investor Essentials Daily:
Thursday Tearsheets
Powered by Valens Research
Patent trolls do not have a positive connotation. These companies acquire and develop patents with no intent of using them. Instead, these firms hope to find a company to license the patents to. Or even more suspiciously, these companies wait for another business to use the patents so they can sue and force profitable companies to pay a licensing fee for the patents.
Even given their negative reputation, patent trolls have been around for centuries. One of the first patent trolls was actually widely respected…Thomas Edison.
Thomas Edison is famous for creating the telephone, light bulb, and motion pictures. In total, Thomas Edison patented roughly 1,000 inventions. His creations fundamentally changed the world. However, he regularly did not try to sell his inventions himself. Instead, he licensed many of his innovations like a patent troll would.
Arguably his most important invention was the lightbulb, as quite literally lighting the world. To this day, companies are still able to make a living off of Edison’s invention, including Acuity Brands (AYI).
Acuity is the largest lighting manufacturer in North America and the firm provides lighting infrastructure for companies all over the world. However, Acuity has relatively weak returns given that its primary technology is over 140 years old, meaning it doesn’t owe Edison any licensing fees.
As-reported return on assets (ROA) fell over the past four years. It currently stands at just 9%, barely above the firm’s cost-of-capital.
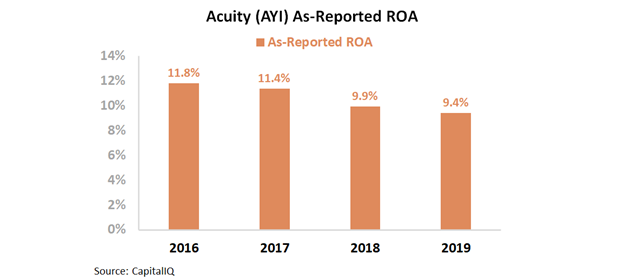
However, this is not an accurate representation of the firm. Its true profitability levels have been falling, yet they are falling from much higher levels. GAAP is grossly overstating Acuity’s asset base because of misrepresentations in goodwill and intangibles, among other distortions. This has the effect of artificially decreasing the firm’s ROA.
Uniform Accounting metrics show Acuity’s ROA was actually 28% this past year, materially higher than an as-reported ROA of 9%.

Uniform Accounting shows Acuity has profitability levels much higher than much of the market thinks.
Also, it is important to see what the market is expecting the firm to accomplish in future years. We can use the Embedded Expectations Analysis in order to see specifically what the market expects of Acuity.
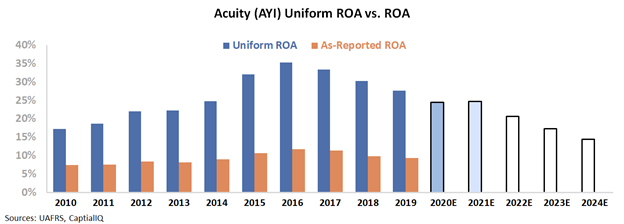
The chart below explains the company’s historical corporate performance levels, in terms of Uniform ROA (dark blue bars) versus what Wall Street sell-side analysts think the company is going to do in the next two years (light blue bars) and what the market is pricing in at current valuations (white bars).
From the graph, it is clear to see Uniform ROA has been falling in recent years. Sell-side analysts think the trend is going to slow. They believe Uniform ROA will fall slightly this year due to coronavirus pressures. Then in 2021, analysts are projecting Uniform ROA to hold steady at 25%.
However, the market is projecting a rapid decline in Uniform ROA after 2021. By 2024, the market is expecting the firm’s Uniform ROA to fall to only 15%, a level it has not seen since 2006. This is quite bearish for a firm with such a large market share.
It appears investors are incorrectly focusing on the company’s as-reported metrics. Metrics that are undervaluing Acuity. As-reported ROAs have barely been able to surpass the firm’s cost-of-capital and investors, pricing in a decline, are expecting that to continue.
However, Uniform Accounting shows it is indeed possible to still profit off of Thomas Edison’s inventions. Without Uniform metrics and the Embedded Expectation Analysis, investors might miss out on this bright opportunity.
Acuity Brands, Inc. Embedded Expectations Analysis – Market expectations are for Uniform ROA to decline, and management may be concerned about gross margins, their positioning, and Ushio America
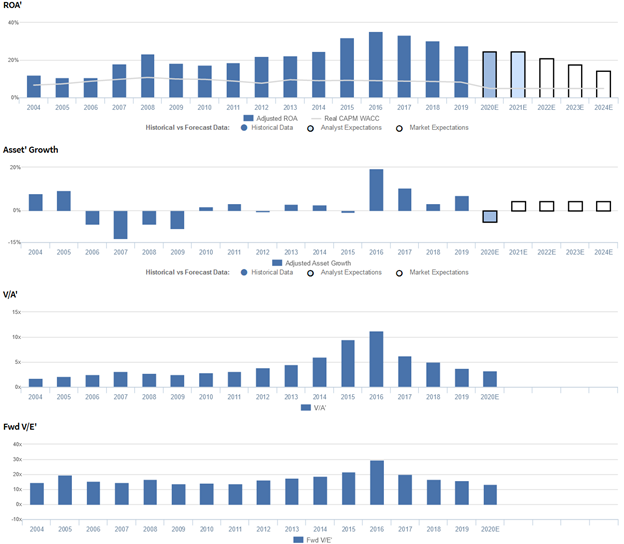
AYI currently trades at a historical low relative to Uniform earnings, with a 13.6x Uniform P/E (Fwd V/E’). At these levels, the market is pricing in expectations for Uniform ROA to decline from 28% in 2019 to 15% in 2024, accompanied by 4% Uniform asset growth.
Meanwhile, analysts have less bearish expectations, projecting Uniform ROA to only fade to 25% in 2021, accompanied by 6% Uniform asset contraction.
Historically, AYI has seen generally improving, robust profitability.
After rising from 11%-12% levels in 2004-2006 to 23% in 2008, following the firm’s spin-off of Zep in 2007, Uniform ROA fell to 17% in 2010. Subsequently, Uniform ROA expanded to a peak of 35% in 2016 before regressing to 28% in 2019.
Meanwhile, Uniform asset growth has been volatile, positive in only ten of the past sixteen years, while ranging from -13% to 20%.
Performance Drivers – Sales, Margins, and Turns
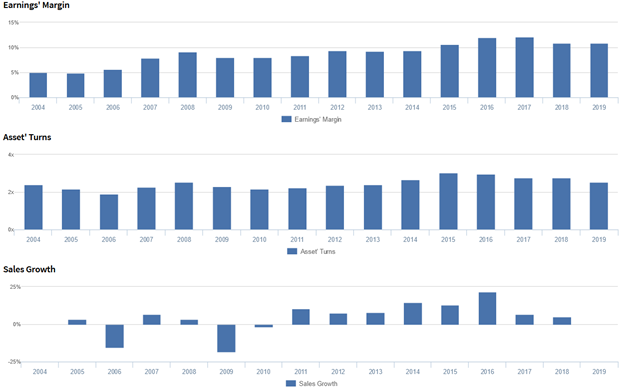
General improvements in Uniform ROA have been driven by compounding trends in Uniform earnings margins and Uniform asset turns.
Uniform margins improved from 5% levels in 2004-2005 to 9% in 2008, before fading to 8% levels in 2009-2011. Subsequently, Uniform margins steadily expanded to 12% peaks in 2016-2017 before falling to 11% levels in 2018-2019.
Meanwhile, Uniform turns declined from 2.4x in 2004 to 1.9x in 2006, before rising to 2.5x in 2008 and fading to 2.2x levels in 2010-2011. Then, after rising to 3.0x peaks from 2015-2016, Uniform turns compressed to 2.5x in 2019.
At current valuations, the market is pricing in expectations for continued declines in both Uniform margins and Uniform turns.
Earnings Call Forensics
Valens’ qualitative analysis of the firm’s Q3 2020 earnings call highlights that management generated an excitement marker when saying that lower shipment levels were a result of exiting certain products with poor financial returns.
However, management is confident that the market has not returned yet.
Furthermore, they may have concerns about the sustainability of gross margin improvement, and about their ability to come out of the current environment as a stronger business.
Moreover, they may lack confidence in their ability to grow net sales and execute on their alliance agreement with Ushio America Incorporated.
Finally, they may be exaggerating the durability of their business model.
UAFRS VS As-Reported

Uniform Accounting metrics also highlight a significantly different fundamental picture for AYI than as-reported metrics reflect.
As-reported metrics can lead investors to view a company to be dramatically stronger or weaker than real operating fundamentals highlight. Understanding where these distortions occur can help explain why market expectations for the company may be divergent.
As-reported metrics significantly understate AYI’s asset utilization, a key driver of profitability. For example, as-reported asset turnover for AYI was just 1.2x in 2019, substantially lower than Uniform asset turns of 2.5x, making AYI appear to be a less efficient business than real economic metrics highlight.
Moreover, since 2015, as-reported asset turnover has maintained 1.1x-1.2x levels, while Uniform turns have fallen from 3.0x to 2.5x over the same time frame, directionally distorting the market’s perception of the firm’s recent asset efficiency trends.
SUMMARY and Acuity Brands, Inc. Tearsheet
As the Uniform Accounting tearsheet for Acuity Brands (AYI:USA) highlights, the Uniform P/E trades at 13.6x, which is below corporate average valuation levels and its own history.
Low P/Es require low EPS growth to sustain them. In the case of Acuity Brands, the company has recently shown a 3% growth in Uniform EPS.
Wall Street analysts provide stock and valuation recommendations that in general provide very poor guidance or insight. However, Wall Street analysts’ near-term earnings forecasts tend to have relevant information.
We take Wall Street forecasts for GAAP earnings and convert them to Uniform earnings forecasts. When we do this, Acuity Brands’ Wall Street analyst-driven forecast is a 17% shrinkage in 2020, before a 3% EPS growth in 2021.
Based on the current stock market valuations, we can use earnings growth valuation metrics to back into the required growth rate to justify Acuity Brands’ $109 stock price. These are often referred to as market embedded expectations.
The company can have Uniform earnings shrink by 9% each year over the next three years and still justify current prices. What Wall Street analysts expect for Acuity Brands’ earnings growth is below what the current stock market valuation requires in 2020, but above the requirement in 2021.
Furthermore, the company’s earning power is 5x above the corporate average. Additionally, cash flows are well above their total obligations—including debt maturities, capex maintenance, and dividends. Together, this signals low credit and dividend risk.
To conclude, Acuity Brands’ Uniform earnings growth is near peer averages, and the company is trading around average peer valuations.
Best regards,
Joel Litman & Rob Spivey
Chief Investment Strategist &
Director of Research
at Valens Research


