
This construction equipment hegemon is going to win from an infrastructure boom, as-reported metrics wrongly say investors shouldn’t care

Today’s firm is the most recognized construction equipment company in the country.
The company can be seen at virtually every construction site in the United States, and is set to benefit from huge infrastructure spending. As-reported metrics show a boring, cyclical return, but Uniform Accounting reveals the value hidden within this resilient business.
Also below, Uniform Accounting Embedded Expectations Analysis and the Uniform Accounting Performance and Valuation Tearsheet for the company.
Investor Essentials Daily:
Tuesday Tearsheets
Powered by Valens Research
During the Great Depression, one of the biggest ways that FDR and the US government tried to kick-start the economy was through infrastructure spending.
These included the Tennessee Valley Authority, Public Works Administration, Civilian Conservation Corporation and others. The focus was to invest big in infrastructure. They knew the massive need for labor could kick-start the economy.
It would also help put assets in place to drive growth in the future. Our Director of Research recently went to Cooperstown NY and saw firsthand the attempts in earnest from some states to start a “mini New Deal” of infrastructure spending to restart the U.S. economy.
As he got off Interstate 88, his first two attempts to get off the highway were met with a closed road due to massive construction projects. Since the start of the pandemic, NY State’s infrastructure spend has been booming.
Not only is this massive spend currently underway, but there are signs more could be coming. The current administration is potentially preparing a nearly $1 trillion infrastructure proposal.
This is one way to spur the US economy back to life and create jobs lost in the pandemic.
Whenever there is new infrastructure, one of the big winners is always Caterpillar (CAT). It is one of the largest manufacturers of construction equipment in the world, and a clear winner during times of massive capital investment.
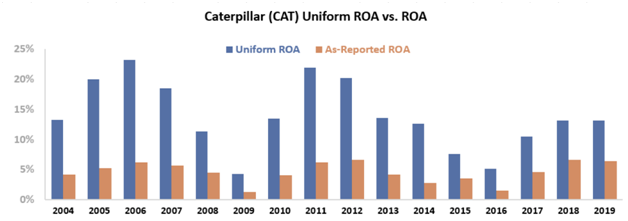
Despite being a dominant market leader, Caterpillar has produced lackluster as-reported return on assets (“ROA”). Its peak ROA over the last 15 years is 6%, just barely above cost-of-capital levels.

Investors looking at these numbers naturally are concerned that Caterpillar is a weak business with little room for operational improvement.
In reality though, investors looking at this data are being misled by incorrect GAAP accounting. Once Uniform Accounting adjustments are made to remove those distortions, it is clear Caterpillar historically has been able to generate much higher returns.
Uniform ROA’s have been over double the as-reported numbers for each of the past 15 years. Not only that, but it expanded ROA’s following the great recession in 2009.
Caterpillar is an impressively profitable, if cyclical, business.
With the company’s weak as-reported numbers, a 27x price to earnings (P/E) does not make sense. But it starts to take shape when you take into account the huge potential boom in infrastructure spending. Not to mention Caterpillar’s central role in it, and how that could supercharge ROAs like in 2006 and 2011.
Similar to the huge growth in Uniform ROA following the great recession in 2009, Caterpillar is at the forefront of another spending boom.
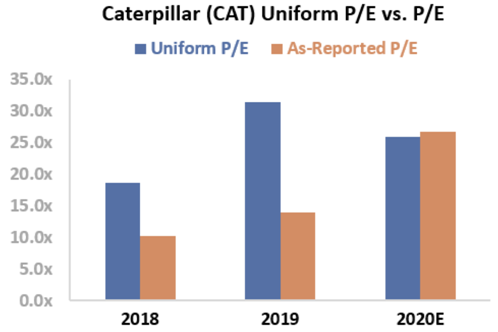
With much of the economy frozen, investors taking a quick look at Caterpillar’s as-reported metrics would be quickly scared away. They are being priced as a high growth company with low historical returns.
In reality, Caterpillar is a high return business well positioned to take advantage of massive trends in the construction industry.
Caterpillar Inc. Embedded Expectations Analysis – Market expectations are for Uniform ROA to improve, but management may be concerned about their financial strength, supply chain, and dealer inventory levels
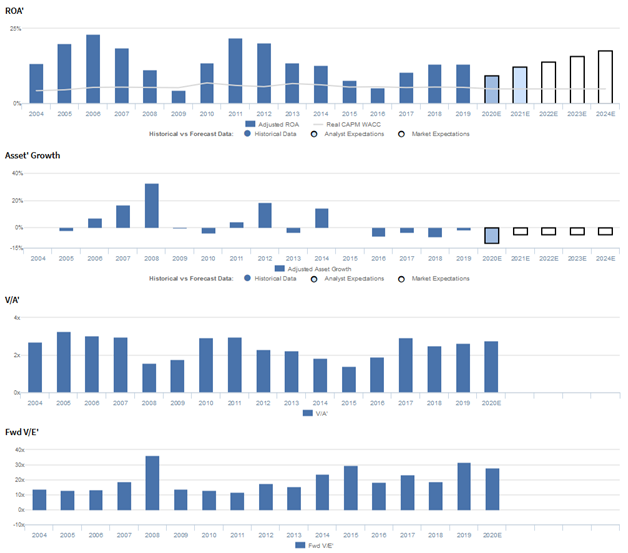
CAT currently trades above corporate averages relative to Uniform earnings, with a 26.9x Uniform P/E (Fwd V/E’). At these levels, the market is pricing in expectations for Uniform ROA to improve from 13% in 2019 to 15% in 2024, accompanied by 4% Uniform asset shrinkage going forward.
However, analysts have somewhat bearish expectations, projecting Uniform ROA to slightly fade to 11% in 2021, accompanied by 4% Uniform asset shrinkage.
Historically, CAT has seen cyclical, generally declining profitability, with Uniform ROA reaching cycle peaks of 23% in 2006, 22% in 2011, and 13% levels in 2018-2019 and cycle lows of 4% in 2009 and 5% in 2016.
Meanwhile, Uniform asset growth has been volatile, positive in six of the past sixteen years, while ranging from -7% to 33%.
Performance Drivers – Sales, Margins, and Turns
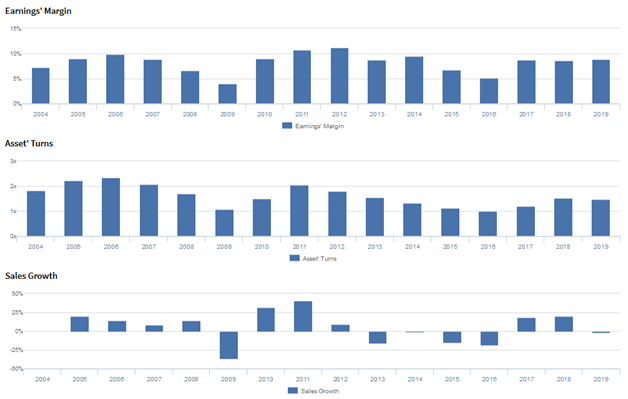
Cyclicality in Uniform ROA has been driven by compounding cyclical trends in Uniform earnings margins and Uniform asset turns.
From 2004-2006, Uniform margins rose from 7% to 10% before falling to 4% in 2009. Then, after expanding to 11% peaks in 2011-2012, Uniform margins declined to 5% in 2016 and rebounded to 9% levels in 2017-2019.
Meanwhile, Uniform turns improved from 1.8x in 2004 to 2.4x in 2006 before falling to 1.1x in 2009. Thereafter, Uniform turns recovered to 2.0x in 2011 and subsequently declined to just 1.0x in 2016, before rebounding to 1.5x levels in 2018-2019.
At current valuations, the market is pricing in expectations for both Uniform margins and Uniform turns to improve.
Earnings Call Forensics
Valens’ qualitative analysis of the firm’s Q1 2020 earnings call highlights that management generated an excitement marker when saying Caterpillar inventory levels rose in production stores in anticipation of higher production levels for the quarter.
However, they are also confident that they had lower end-user demand than their internal expectations.
In addition, management may have concerns about increases in dealer inventory levels, lower recip oil and gas sales, and weakness in their oil and gas-related equipment business.
Furthermore, they may be overstating the sustainability of reduced restructuring costs, their ability to mitigate supply chain disruptions, and the financial strength of their company and their customers. Also, they may be concerned about the ability of dealers to decrease inventory levels, their use of Cat Command for hauling, and potential increases in past due payments and write-offs.
Meanwhile, management may lack confidence in their ability to sustain sales and revenues growth, ship products and parts to customers, and optimize equipment availability in areas of strong demand.
Additionally, they may have concerns about their employee benefit plans, their ability to reduce discretionary expenses, and the impact of coronavirus.
Moreover, they may lack confidence in their ability to support their suppliers in the event of financial distress, and they may have concerns about negative pricing pressure from their geographic sales mix.
UAFRS VS As-Reported

Uniform Accounting metrics also highlight a significantly different fundamental picture for CAT than as-reported metrics reflect.
As-reported metrics can lead investors to view a company to be dramatically stronger or weaker than real operating fundamentals highlight. Understanding where these distortions occur can help explain why market expectations for the company may be divergent.
As-reported metrics significantly understate CAT’s asset utilization, one of the key drivers of profitability. For example, as-reported asset turnover for CAT was 0.7x in 2019, materially lower than Uniform asset turns of 1.5x, making CAT appear to be a less efficient business than real economic metrics highlight.
Moreover, since 2004, as-reported asset turnover has never surpassed 0.8x levels, while Uniform turns have ranged above 1.0x in each year over the same timeframe, significantly distorting the market’s perception of the firm’s historical asset efficiency ceiling.
SUMMARY and Caterpillar Inc. Tearsheet
As the Uniform Accounting tearsheet for Caterpillar Inc. (CAT:USA) highlights, the Uniform P/E trades at 26.9x, which is above corporate average valuation levels and its historical averages.
High P/Es require high EPS growth to sustain them. In the case of Caterpillar, the company has recently shown a 7% Uniform EPS growth.
Wall Street analysts provide stock and valuation recommendations that in general provide very poor guidance or insight. However, Wall Street analysts’ near-term earnings forecasts tend to have relevant information.
We take Wall Street forecasts for GAAP earnings and convert them to Uniform earnings forecasts. When we do this, Caterpillar’s Wall Street analyst-driven forecast is a 39% shrinkage in 2020, followed by a 33% growth in 2021.
Based on the current stock market valuations, we can use earnings growth valuation metrics to back into the required growth rate to justify Caterpillar’s $133 stock price. These are often referred to as market embedded expectations.
The company can have Uniform earnings shrink by 3% each year over the next three years and still justify current prices. What Wall Street analysts expect for Caterpillar’s earnings growth is far above what the current stock market valuation requires in 2021.
Furthermore, the company’s earning power is 2x the corporate average. However, the company’s cash flows and cash on hand will consistently fall short of debt headwalls over the next five years. Together, this signals high dividend risk.
To conclude, Caterpillar’s Uniform earnings growth is above peer averages. Therefore, as is warranted, the company is trading above average peer valuations.
Best regards,
Joel Litman & Rob Spivey
Chief Investment Strategist &
Director of Research
at Valens Research


