
Contrary to distorted as-reported numbers, this company is a great example of the Efficient Market Theory in action

For many years, this company’s as-reported financials seemed to line up with its stock market returns. However, once the company began its acquisition strategy, the stock’s movements and as-reported accounting diverged.
Investors looking at bad data might have thought that it was an opportunity to trade the company. They were wrong, as this company was still a great example of the Efficient Market Hypothesis.
Investors just had to be looking at the right, Uniform, data to realize the market understood the company all along.
Also below, Uniform Accounting Embedded Expectations Analysis and the Uniform Accounting Performance and Valuation Tearsheet for the company.
Investor Essentials Daily:
Thursday Tearsheets
Powered by Valens Research
Despite the fact that a big part of what we do here at Valens is look for interesting stock opportunities, we’re actually believers in the Efficient Market Hypothesis (“EMH”).
This is of course the idea that, generally speaking, the stock market is efficient, making it nearly impossible to find mispriced equities and even tougher to consistently beat the market.
EMH can actually be broken down into three ideologies formalized by Eugene Fama: strong, semi-strong, and weak.
When most investors hear EMH, they think of the strong-form version, which states that stock prices are already pricing in all information—past and present, public and private. This would mean that traditional investment analysis is of no value and beating the market without using non-public information is purely luck-based.
Semi-strong EMH states that public information is immediately priced into the stock when it is released, making it very difficult to act before the stock is fairly valued again.
Meanwhile, weak efficiency would suggest that only past information is priced into the stock, meaning that the market is rife with mispriced stocks.
If you were to ask which of these levels of the EMH most at Valens agree with, we’d probably come around to agreeing the semi-strong EMH is closest to reality—with a margin of error. That is to say that, of every 100 companies we look at, between 90%-95% are fairly valued, reflecting all the available information on the company. These stocks accurately track the companies’ true earning power.
Over time, we have been able to track this by looking at companies’ total shareholder return (“TSR”) relative to the market and comparing that TSR to Uniform profitability metrics.
Most of the time, we see a strong relationship between TSR and Uniform Earnings growth, as measured by Uniform ROA and Uniform Asset growth. On the other hand, as-reported metrics tend to have a much weaker relationship with TSR.
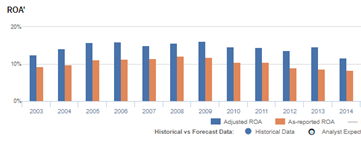
Becton, Dickinson and Company (BDX) is a great example of this relationship. Historically, Becton-Dickinson had strong, but fairly stable profitability on both an as-reported and a Uniform basis, with Uniform ROA ranging from 12%-16% through 2014.
Over the same 10-year period, the company’s TSR slightly outperformed the market, but experienced only modest returns.

Starting in 2015, as-reported and Uniform metrics diverged. That same year, the company acquired CareFusion in a savvy move to improve its patient safety and medication management operations. Just two years later, Becton-Dickinson continued growing by acquiring C.R. Bard in an effort to bulk out its products and innovation pipeline.
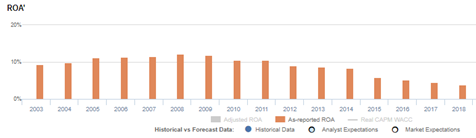
Looking at as-reported ROA, it looks like Becton-Dickinson failed with these initiatives. Since 2014, ROA has declined from 8% to 4%.
Puzzlingly, from 2015 to 2018, Becton-Dickinson’s TSR nearly doubled relative to the market. Did the market misunderstand Becton-Dickinson’s success? Could it therefore be a short opportunity?

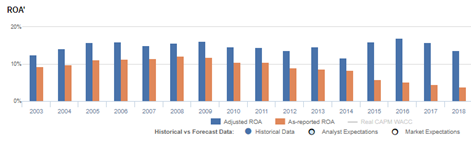
The move finally starts to make sense when we look at the company’s Uniform ROA, which improved to a new high of 17% in 2016, and it remained at 16% levels through the C.R. Bard acquisition.
The company also was growing during that time, through its acquisitions and organic growth. Recently, Becton-Dickinson’s TSR has inflected negatively. When we look at the Uniform ROA, this move again makes sense, just like the rally higher from 2014 through 2017-2018.
The market once again understands what is happening with the company, as Uniform ROA has started slipping back towards average levels.
Not only have returns started to fade, during the company’s most recent earnings call, management generated less optimistic signals about their ability to continue pushing EPS and revenue going forward.
In terms of the Efficient Market Hypothesis, it appears Becton-Dickinson may be one of the 90%-95% of companies the market understands, contrary to what investors looking at as-reported metrics might think.
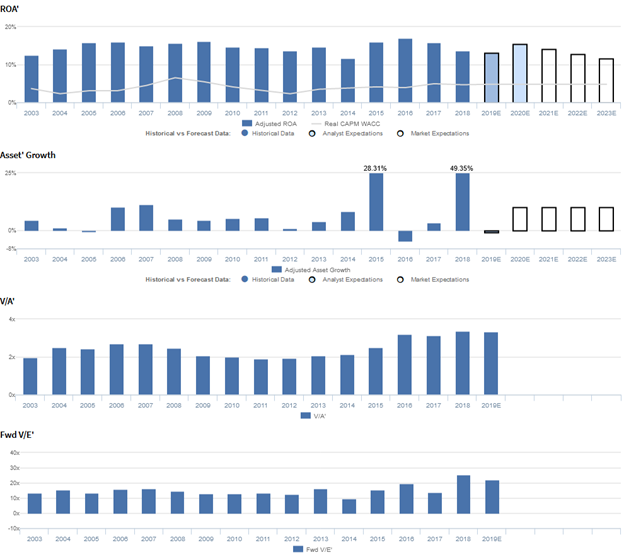
Becton, Dickinson and Company Embedded Expectations Analysis – Market expectations are for Uniform ROA to remain muted, and management may be concerned about EPS, revenue, and their competitive moat
BDX currently trades near corporate averages relative to Uniform Earnings, with a 22.0x Uniform P/E (Fwd V/E′).
At these levels, the market is pricing in expectations for Uniform ROA to sustain 14% levels from 2018 to 2023, accompanied by 5% Uniform Asset growth going forward.
Meanwhile, analysts have bullish expectations, projecting Uniform ROA to improve to 16% in 2020, accompanied by 1% Uniform Asset shrinkage.
Historically, BDX has seen robust and fairly stable profitability
After improving from 13% in 2003 to 15% in 2004, Uniform ROA stabilized at 15%-16% levels through 2011, before falling to 12% in 2014. Thereafter, Uniform ROA expanded to a peak of 17% in 2016, driven by the firm’s acquisition of CareFusion, before fading to 14% in 2018.
Meanwhile, Uniform Asset growth has been consistent, positive in 14 of the past 16 years, while ranging from -5% to 11%, excluding 28% and 49% growth, related to their 2015 acquisition of CareFusion and 2018 acquisition of C. R. Bard, respectively.
Performance Drivers – Sales, Margins, and Turns
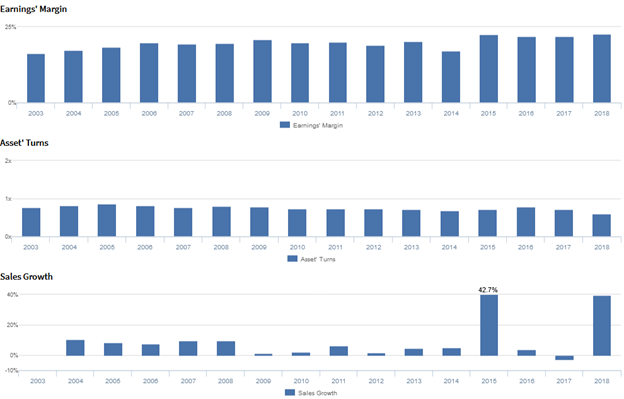
Trends in Uniform ROA have been driven primarily by trends in Uniform Earnings Margin, and to a lesser extent, Uniform Asset Turns.
From 2003-2009, Uniform Margins improved from 16% to 21%, before fading to 17% in 2014 and expanding to peak 22%-23% levels in 2015-2018.
Meanwhile, after improving from 0.8x in 2003 to 0.9x in 2005, Uniform Turns stabilized at 0.8x levels through 2009, before fading to 0.6x through 2018.
At current valuations, the market is pricing in expectations for Uniform Turns to remain at current lows, coupled with a reversal of improvements in Uniform Margins.
Earnings Call Forensics
Valens’ qualitative analysis of the firm’s Q4 2019 earnings call highlights that management may lack confidence in their ability to effectively invest in their growth-based strategy and sustain their recent EPS improvement.
Furthermore, they may be concerned about the impact of FX on their profitability and about further pricing pressures in Chinese markets.
Finally, they may lack confidence in their ability to sustain recent revenue growth, and they may be exaggerating the strength of their competitive moats.
UAFRS VS As-Reported

Uniform Accounting metrics also highlight a significantly different fundamental picture for BDX than as-reported metrics reflect.
As-reported metrics can lead investors to view a company to be dramatically stronger or weaker than real operating fundamentals highlight.
Understanding where these distortions occur can help explain why market expectations for the company may be divergent.
As-reported metrics significantly understate BDX’s profitability.
For example, as-reported ROA for BDX was just 4% in 2018, substantially lower than Uniform ROA of 14%, making BDX appear to be a much weaker business than real economic metrics highlight.
Moreover, since their acquisition of CareFusion, as-reported ROA has declined from 8% in 2014 to 4% in 2018, while Uniform ROA has expanded from 12%-14%, distorting the market’s perception of the firm’s ability to make accretive acquisitions.
SUMMARY and Becton, Dickinson and Company Tearsheet
As the Uniform Accounting tearsheet for Becton, Dickinson and Company (BDX) highlights, the Uniform P/E trades at 22x, which is around the global corporate average valuation levels and its own recent history.
High P/Es require high EPS growth to sustain them. In the case of BDX, the company has recently shown an 25% Uniform EPS growth.
Wall Street analysts provide stock and valuation recommendations that in general provide very poor guidance or insight. However, Wall Street analysts’ near-term earnings forecasts tend to have relevant information.
We take Wall Street forecasts for GAAP earnings and convert them to Uniform earnings forecasts. When we do this, BDX’s Wall Street analyst-driven forecast is -7% into 2019. That rebounds with 24% growth in earnings from 2019 to 2020.
Based on current stock market valuations, we can back into the required earnings growth rate that would justify $260 per share. These are often referred to as market embedded expectations. In order to meet the current market valuation levels of BDX, the company would have to have Uniform earnings grow by 12% each year over the next three years.
What Wall Street analysts expect for BDX’s earnings growth increases far above what the current stock market valuation requires.
Meanwhile, the company’s earnings power is 2x corporate averages, signaling that there is very low cash flow risk to the company’s operations and credit profile.
To conclude, BDX’s Uniform earnings growth is above peer averages in 2019. Also, the company is trading at well above average peer valuations.
Best regards,
Joel Litman & Rob Spivey
Chief Investment Strategist &
Director of Research
at Valens Research


