
The most boring market in finance can also be its most terrifying

September 2008 was a truly terrifying month for anyone in finance.
Fannie and Freddie went into conservatorship on the 7th.
Bank of America bought Merrill Lynch on the 14th, to prevent it going under when Lehman declared bankruptcy the next day, on the 15th.
On the 17th, the Fed took a 79.9% stake in AIG after the firm admitted it had blown a Tsar Bomba sized hole in its balance sheet using CDS.
I could go on, just a few other key events include JPMorgan buying Washington Mutual, the SEC banning selling financial stocks short, Goldman and Morgan Stanley converting to banks, Citigroup buying Wachovia, the announcement of TARP…
But the scariest, most wide-ranging threat to the entire global economic system happened on September 16th.
The Reserve Primary Fund “broke the buck.” The Reserve Primary Fund was a large money market fund. Breaking the buck meant that the Reserve Primary Fund was no longer going to guarantee that if you had $1 in the fund, you could redeem it for $1.
The Reserve Primary Fund broke the buck because of Lehman debt they were holding when the investment bank went bankrupt.
The premise of holding to a $1 NAV, or net asset value, for all money market fund had been, and still is, a vital part of their existence. It gives people the belief their assets are secure in a “risk-less” vehicle that is like cash, but can earn a modest return.
The money market is vital part of financial markets. At any given time, huge amounts of assets are sitting in cash, either as they go from one investment to another, or as an investment preference. Money markets take the assets that investors put in them, and make short-term loans to earn a modest return on those assets, financing significant portions of the financial system in the process.
But people will only put money in money market funds if they have confidence they can get that money back out. If they believe they cannot, then a run, much like the run on banks in 1929 that helped contribute to the Great Depression, will occur.
When the Reserve Primary Fund broke the buck, a run is exactly what happened. Over the 4 days after they reported they wouldn’t hold NAV at $1, redemption requests for $60 billion were made from the $62 billion fund.
And the Reserve Primary Fund wasn’t the only fund that started to have a run because of this. $498 billion of prime money market fund assets were withdrawn in a few days time, 24% of the total market at the time. Debt markets had already started to freeze, but this move would turn them into the deep arctic.
And so because of that, the US Treasury stepped in on 9/19 and guaranteed all money market funds, to stabilize the market. To prevent the debt markets from completely freezing up, sending the entire global economy into free fall.
When they did that, one major beneficiary was Federated Investors (FII).
Most investors think of Federated as a equity and credit mutual fund and separately managed account business, but $359 billion of their $527 billion in assets under management (AUM) are money market funds. While they have been investing in growing their equity asset management business, this business still contributes 30% of the investment managers’ net revenue, down from over 50% in 2008-2009. This has ramped recently after having been relatively flat for the last several years.
It is Federated’s investment in this business, and their asset light model of aggregating asset managers and running them on one system that has enabled them to consistently have robust profitability. For context, Federated’s Uniform Return on Assets is over 100%, and has been every year since 2012. Said differently, after accounting adjustments are made Federated makes more than $1 for every dollar they put into the business. There are few businesses that can say that.
The company’s returns are so unbelievable, and investors’ focus on their business is so centered around the risk to their actively managed equity business being attacked by the rise of passives, that the market expects their returns to be cut in half. However, management is showing confidence around the performance of their funds, and their strong positioning in the money market space offering them sustainable robust returns. Current market sentiment looks to be too negative on the company.
We’re Relaunching Our Portfolio Audit Review Offering – And Making A Special Offer
For our institutional clients, we don’t just provide access to our Valens Research app. We also do bespoke research. We produce one-off deep-dive company analyses using all our tools, including Uniform Accounting, credit work, and our management compensation and earnings call analysis. We monitor their portfolios for potential Uniform Accounting signals to alert them. We provide custom datasets for quantitative analysis, and provide aggregate analytics. We also help them create unique idea generation screens that are customized to their approach, using Uniform Accounting and our other analytics.
But for most of our institutional clients, the analysis that they find most useful, and almost universally ask for, is a quarterly portfolio audit and call with our analysts.
Our institutional clients pay a significant premium for all our bespoke research. Some of our institutional clients have paid well over $100,000 a year for our uniquely tailored Uniform Accounting research, because of the value it adds to their process.
Until Thanksgiving, we’re making a special offer.
For any investor that buys access to the Valens Research app ($10,000/year subscription), we will include an Institutional-level portfolio audit and call with our analyst team with no extra charge.
Also, for those people who sign up to the offer before end of day on November 15th, we’ll include one year of access to all of our newsletters, including our Market Phase Cycle™ and Conviction Long Idea List (a $6,000 value), for no extra charge.
We want to help show you how powerful Uniform Accounting research can be for your investment strategy.
If you want to hear more about this offer, or are interested in subscribing, feel free to reply to this email. I’ll forward on your note to our head of client servicing. Or, feel free to reach out to Doug Haddad, the head of our client relations team, at doug.haddad@valens-securities.com or at 630-841-0683.
To read more about the offer and sign up, you can also click here.
Market expectations are for Uniform ROA to decline, but management is confident about their funds, costs, and market share
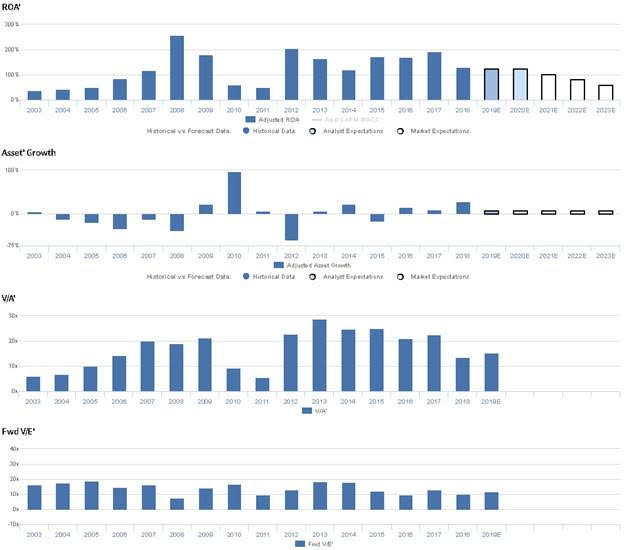
FII currently trades below historical averages relative to UAFRS-based (Uniform) Earnings, with an 11.7x Uniform P/E. At these levels, the market is pricing in expectations for Uniform ROA to decline significantly, from 131% in 2018 to 61% in 2023, accompanied by 7% Uniform Asset growth going forward.
Meanwhile, analysts have less bearish expectations, projecting Uniform ROA to remain in the 126-131% range through 2020, accompanied by 6% Uniform Asset growth.
Historically, FII has seen robust, but somewhat volatile, profitability. Uniform ROA improved from 37% in 2003 to a high of 259% in 2008. Subsequently, Uniform ROA collapsed to 51% by 2011, before expanding to 206% in 2012, declining to 120% in 2014, and improving to 192% in 2017. Most recently, Uniform ROA fell back to 131% in 2018. Meanwhile, Uniform Asset growth been volatile, positive in nine of the past sixteen years, while ranging from -60% to 100% growth.
Performance Drivers – Sales, Margins, and Turns
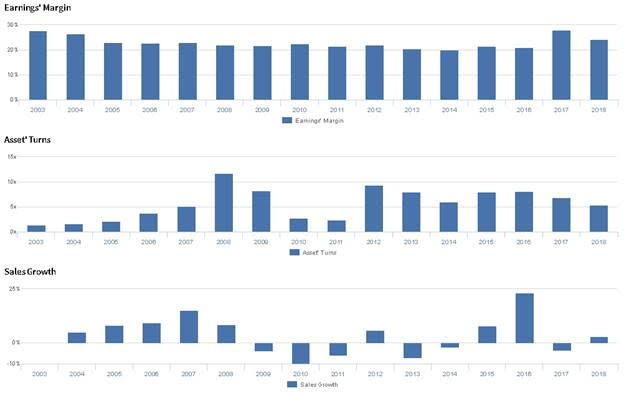
Robust Uniform ROA has been driven by robust Uniform Earnings Margin, while volatility has been driven by volatile Uniform Asset Turns. Uniform Margins declined from 29% in 2003 to 20% levels in 2014, before improving to 28% in 2017 and retracting to 24% in 2018. Meanwhile, Uniform Turns have been more volatile, improving from 1.3x in 2003 to 11.8x in 2008, before declining to 2.4x levels in 2011. Subsequently, Uniform Turns expanded to 9.3x in 2012, and compressed back to 5.4x in 2018. At current valuations, markets are pricing in expectations for Uniform Margins and Uniform Turns to fall.
Earnings Call Forensics
Valens’ qualitative analysis of the firm’s Q2 2019 earnings call highlights that management is confident 15% of their funds are in the top quartile and 65% are in the top half, and they are confident they realized lower stock compensation expenses in Q2. Furthermore, they are confident customers recognize them as a go-to player in the money market space.
However, management may lack confidence in their ability to grow Hermes EOS assets under administration and to grow their APAC business. Additionally, they may be concerned about the impact of ongoing rate cuts and about the value of their branding in Europe.
UAFRS VS As-Reported
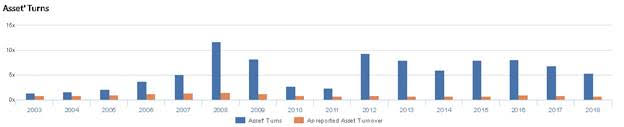
Uniform Accounting metrics also highlight a significantly different fundamental picture for FII than as-reported metrics reflect. As-reported metrics can lead investors to view a company to be dramatically stronger or weaker than real operating fundamentals highlight. Understanding where these distortions occur can help explain why market expectations for the company may be divergent.
As-reported metrics significantly understate FII’s asset utilization, a key driver of profitability. For example, as-reported asset turnover for FII was just 0.7x in 2018, materially lower than Uniform Turns of 5.4x, making FII appear to be a much less efficient business than real economic metrics highlight. Moreover, as-reported asset turnover has been less than half Uniform Turns for the past 16 years, most notably in 2008, when as-reported asset turnover was 1.4x, markedly smaller than the Uniform Turns of 11.8x. Consequently, as-reported metrics have historically distorted the market’s perception of FII’s asset efficiency levels and trends.
Today’s Tearsheet
Today’s tearsheet is for Novartis. Novartis trades at a significant premium to market average valuations. The company has historically has robust Uniform EPS growth, though it is forecast to see significant negative earnings growth in 2019. The company’s earnings growth is significantly below peers, while valuations are well above peer averages. The company has declining profitability, and will need to manage their capital structure to sustain their dividend.
Regards,
Joel Litman
Chief Investment Strategist


