
Just Because a Stock Falls 60% Doesn’t Make It a Screaming Buy

One of a value investor’s favorite screens is looking at the list of companies that just hit a 52-week low.
When a company is trading at the bottom of its recent trading range, it can be a sign it is time to dig in, as Mr. Market has overreacted about the company.
But there’s a reason even the most dogmatic value investor uses 52-week low screens as a screen, and not a quantitative strategy. Meaning, you look for ideas from that list, you don’t just buy the entire list and hold.
The reason being, there’s often a reason the stock is dropping. Sometimes the market is overreacting, but sometimes the market is sniffing out real issues. It takes fundamental research to figure out which is the case.
Tanger Factor Outlet Centers (SKT) is not very far off their 520-week lows, let alone their 52-week lows. The stock has dropped from over $41 at its peak in mid-2016 to $15 currently, a 60% drop.
Value investors have had a few times to kick the tires as it kept showing up on the 52-week low list at the back of the Wall Street Journal.
There’s a simple reason why they haven’t. Even after the stock dropped dramatically, the company’s Uniform (UAFRS) P/E is still at 20.7x levels. The company is only now trading at market average valuations after a 60% drop in the stock price.
The company is not trading at a significant discount to the market. At current valuations the market is just pricing the company’s returns to remain flat going forward, not exactly low investor expectations.
On top of that, discerning investors are aware that the company’s credit profile doesn’t look great. As we highlighted in yesterday’s Valens Research Institutional Daily, paying attention to credit can give early signals for where a stock may trend.
Yesterday we highlighted how for AK Steel (AKS), we were seeing signals the company’s credit was safer than investors recognized, as Cleveland Cliffs (CLF) may have also when they decided to acquire the company.
For Tanger, earlier this year we were highlighting how the company’s bonds were trading at a 4% yield when they should have been trading at a 6% yield. The company’s credit risk was much higher than the market recognized.
Tanger still has credit overhangs, and still isn’t trading at a discount to the market, or to potential intrinsic value, it shouldn’t be on value investors’ radars even as the stock has dropped. Considering management also is showing concerns about their leasing strategy, digital outreach, and their capital deployment strategy, investors may continue to see the company appear on the 52-week low list.
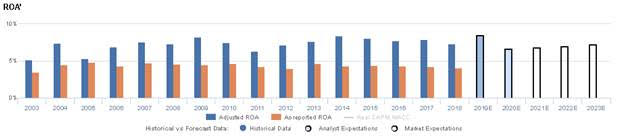
Market expectations are for Uniform ROA to sustain current levels, but management may be concerned about their leasing strategy, digital outreach, and share buybacks

SKT currently trades near corporate averages relative to UAFRS-based (Uniform) Earnings, with a 20.7x Uniform P/E. Even at these levels, the market is pricing in expectations for Uniform ROA to sustain 7% levels through 2023, accompanied by 1% Uniform Asset growth going forward.
Analysts have similar expectations, projecting Uniform ROA to sustain 7% through 2020, accompanied by 5% Uniform Asset shrinkage.
Historically, as a REIT specializing in outlet shopping centers, SKT has seen fairly stable profitability. After improving from 5% in 2003 to 8% in 2009, Uniform ROA compressed to 6% again in 2011, before rising to 8% levels from 2013-2017, and fading to 7% in 2018. Meanwhile, Uniform Asset growth has been fairly consistent, positive in 12 of the past 16 years, while ranging from -4% to 19%, excluding 72% growth in 2003 from their acquisition of a portfolio of nine factory outlet centers.
Performance Drivers – Sales, Margins, and Turns

Trends in Uniform ROA have been driven primarily by trends in Uniform Earnings Margin, coupled with stable Uniform Asset Turns. After compressing from 37% in 2003 to 25% in 2005, Uniform Margins expanded to 37% in 2009, and fell to 29% in 2011. Thereafter, Uniform Margins expanded to 35%-36% levels from 2013-2018. Meanwhile, Uniform Turns have remained stable at 0.2x levels since 2004. At current valuations, markets are pricing in expectations for continued stability in both Uniform Asset Turns and Uniform Earnings Margins.
Earnings Call Forensics
Valens’ qualitative analysis of the firm’s Q3 2019 earnings call highlights that management may be concerned about their value proposition for consumers, and they may lack confidence in the effectiveness of their leasing strategy. Furthermore, they may be concerned about their ability to maintain their low cost of occupancy, and they may lack confidence in their ability to expand their digital outreach. Finally, they may lack confidence in their ability to efficiently invest in their assets, and they may be concerned about the value of their recent share buyback program.
UAFRS VS As-Reported
Uniform Accounting metrics also highlight a significantly different fundamental picture for SKT than as-reported metrics reflect. As-reported metrics can lead investors to view a company to be dramatically stronger or weaker than real operating fundamentals highlight. Understanding where these distortions occur can help explain why market expectations for the company may be divergent.
As-reported metrics significantly understate SKT’s profitability. For example, as-reported ROA for SKT was 4% in 2018, materially lower than Uniform ROA of 7%, making SKT appear to be a much weaker business than real economic metrics highlight. Moreover, as-reported ROA has been well below Uniform ROA in each year since 2006, significantly distorting the market’s perception of the firm’s historical profitability.
Today’s Tearsheet
Today’s tearsheet is for Philip Morris International. Philip Morris trades slightly below market average valuations. The company has recently had neutral +1% Uniform EPS growth. EPS growth is forecast to drop to -7% in 2019 before accelerating significantly in 2020 to 24%. At current valuations, the market is pricing the company to see earnings growth stay negative going forward.
The company’s earnings growth is forecast to be in line with peers, the company is also trading at peer average valuations. The company has strong returns, and no risk to their very healthy dividend yield.
Regards,
Joel Litman
Chief Investment Strategist


