
This company’s products own their categories, driving stable profits, but TRUE valuations show the market is pricing in much more than stability

This company has created brands that have become synonymous with the categories it owns. Because of this the company has been able to produce steady and strong profitability.
But while as-reported valuations look reasonable for the name, TRUE uniform UAFRS-based P/E analysis shows the market expects much stronger returns in the future, which the company may struggle to deliver.
Also below, Uniform Accounting Embedded Expectations Analysis and the Uniform Accounting Performance and Valuation Tearsheet for the company
Investor Essentials Daily:
Thursday Tearsheet & Embedded Expectations
Powered by Valens Research
During World War I, the United States and allies needed a solution to combat chemical warfare in the trenches. Gas masks became ubiquitous on the front lines, but they needed filters to work properly. Cellucotton Products was tasked as one of the suppliers of the crepe paper that helped the soldiers.
After World War I ended, the company had built a proficiency in making these paper products, but had no end market for them. Fortunately, most people didn’t run into mustard gas on a daily basis in civilian life.
So Cellucotton started to look for other outlets. They made the paper thinner and softer and rebranded it for the makeup removal market. In 1924 they introduced their product to the consumer market, asking Hollywood actresses to promote it. They called it Kleenex.
Initially it was solely marketed as a makeup remover, but Kleenex sales took off in 1929 when they started marketing it for its modern use, a “disposable handkerchief”.
Cellucotton became Kimberly-Clark (KMB), but the Kleenex brand never changed, and became ubiquitous. It was so successful it created a product category, and then became the term people use to talk about all facial tissues.
Even calling the product facial tissues sounds weird, if anyone needs to blow their nose, they ask for a Kleenex, no matter what brand they’re using.
Kimberly-Clark is a branding powerhouse when it comes to paper products. Their brands include everything from Kleenex to Cottonelle, Scott, Huggies and Depend diapers, to Kotex.
The strength of their brands has enabled Kimberly-Clark to have remarkably stable returns. Uniform Accounting return on assets (ROA) was around 10%-11% every year from 2003-2013, before it rose to a stable 13% over the past 5 years.
Using as-reported P/E, it appears the market understands this too, with an as-reported P/E of 19x that signifies expectations for strong stable returns, and modest growth.
However, Uniform Accounting metrics highlight the market actually is not pricing in stable returns and modest growth. Kimberly-Clark’s Uniform P/E is actually 26x, well above corporate averages.
The market expects Kimberly-Clark to see Uniform ROA rise from 13% to 16%. Those are lofty expectations, especially for a firm in a mature industry, whose last major successful product introduction, Depend, came out in 1984.
Those expectations look particularly challenging to reach based on management’s outlook. Management is showing concern about their outlook for top-line growth, margins, and new product innovation.
Kimberly-Clark Embedded Expectations Analysis – Markets have bullish expectations for KMB, but management may be concerned about their growth, margins, and innovation

KMB currently trades near historical highs relative to UAFRS-based (Uniform) Earnings, with a 25.5x Uniform P/E. At these levels, the market is pricing in expectations for Uniform ROA to improve from 13% in 2018 to 16% in 2023, accompanied by immaterial Uniform Asset growth going forward.
However, analysts have more bearish expectations, projecting Uniform ROA to fade to 12% levels through 2020, accompanied by 1% Uniform Asset shrinkage.
Historically, KMB has seen fairly stable profitability, with Uniform ROA ranging between 10%-13% since 2003, and remaining at the high end of that range since 2015. Meanwhile, Uniform Asset growth has been fairly volatile, positive in eight of the past sixteen years, while ranging from -8% to 9%.
Performance Drivers – Sales, Margins, and Turns
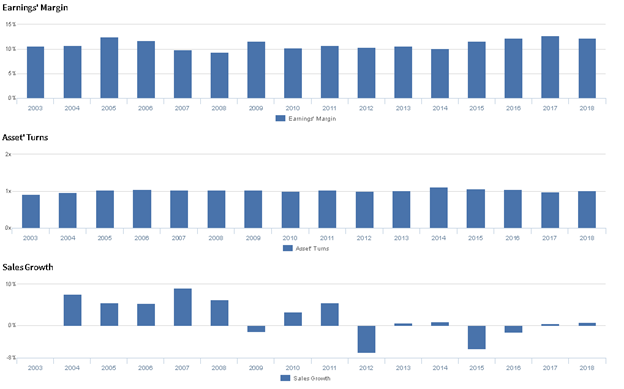
Overall stability in Uniform ROA has been driven by stable Uniform Asset Turns, while recent improvements have been driven by slightly improving Uniform Earnings Margin. Excluding 9% underperformance in 2008, Uniform Margin has ranged between 10%-13% since 2003, most recently stabilizing at 12%-13% levels since 2015. Meanwhile, Uniform Turns have remained stable in the 0.9x-1.1x range since 2003. At current valuations, markets are pricing in expectations for dramatic improvements to both Uniform Margins and Turns.
Earnings Call Forensics
Valens’ qualitative analysis of the firm’s Q2 2019 earnings call highlights that management is confident their 5D diaper is gaining traction in the premium marketplace. That said, management may lack confidence in their ability to meet their full year growth rates and recover recent margin slippage. Furthermore, they may lack confidence in their ability to continue driving growth in China, and they may be concerned about the sustainability of recent momentum for their 5D diaper in the Chinese market. Finally, they may lack confidence in their ability to continue driving product innovation.
UAFRS VS As-Reported

Uniform Accounting metrics also highlight a significantly different valuation picture for KMB than as-reported metrics reflect. As-reported metrics can lead investors to view a company to be dramatically stronger or weaker than real operating fundamentals highlight, or more or less expensive. Understanding where these distortions occur can help explain why market expectations for the company may be divergent.
As-reported metrics significantly understate KMB’s valuations. For example, as-reported P/E for KMB is 19x currently, materially lower than Uniform P/E of 26x, making KMB appear to be a much less expensive business than real economic metrics highlight. Moreover, as-reported P/E has been roughly 5-6 turns lower than Uniform P/E for most of the past 10 years, significantly distorting the market’s perception of the firm’s valuation trends.
Kimberly-Clark Tearsheet
As our Uniform Accounting tearsheet for Kimberly-Clark highlights, Kimberly-Clark trades above market average valuations. The company has recently had 1% Uniform EPS growth. EPS growth is forecast to turn negative, at -8% in 2019, before inflecting to positive 10% in 2020. At current valuations, the market is pricing the company to see earnings grow by 3% a year going forward.
The company’s earnings growth is forecast to be slightly below peers in 2019, but the company also trades at a slight premium to peer average valuations. The company has average returns relative to current corporate averages, and moderate cash flow risk to their dividend.
Best regards,
Joel Litman & Rob Spivey
Chief Investment Strategist &
Director of Research
at Valens Research


