
The true titans of finance

When someone refers to the titans of finance, people often think of names like Steven Schwartzman in private equity, Jamie Dimon in traditional banking, Ken Moelis in investment banking, or Steve Cohen for hedge funds. But this is really missing the forest from the trees.
Each of those powerbrokers fuels their success through their ability to accumulate assets that they can then see deployed elsewhere. Schwartzman uses client assets to buy businesses. Dimon uses client deposits to lend to businesses and consumers. Moelis convinces investors to buy the latest IPO or support an M&A deal. Cohen uses his and client’s assets to invest in public equity markets.
The key thing they all need though, is they need client assets to do that. There’s one group of people who have client assets in spades.
Registered Investment Advisors, called RIAs or private wealth managers (PWMs). These are the people who work directly with clients to manage their money. Everyone from an average on the street investor to high net worth individuals worth hundreds of millions, or billions. They help them understand how to build a portfolio that suits their and their families needs.
They are the ones that help decide if those alleged titans of finance get the capital they so desperately want for investing. They hold the keys.
They’re the real titans of finance at the end of the day.
There’s one company in particular that focuses on supporting these powerbrokers, LPL Financial. LPL offers RIAs a backbone to operate their business, including solutions around research,execution, marketing solutions, and various other back-office needs. It enables their clients, the RIAs, to focus on their core competency, meeting with clients, managing client capital, and meeting with prospects.
RIAs have rewarded them for their strong offering by joining LPL in growing numbers, which the market has started to notice. It is part of what has driven the stock to rise over 100% since 2017.
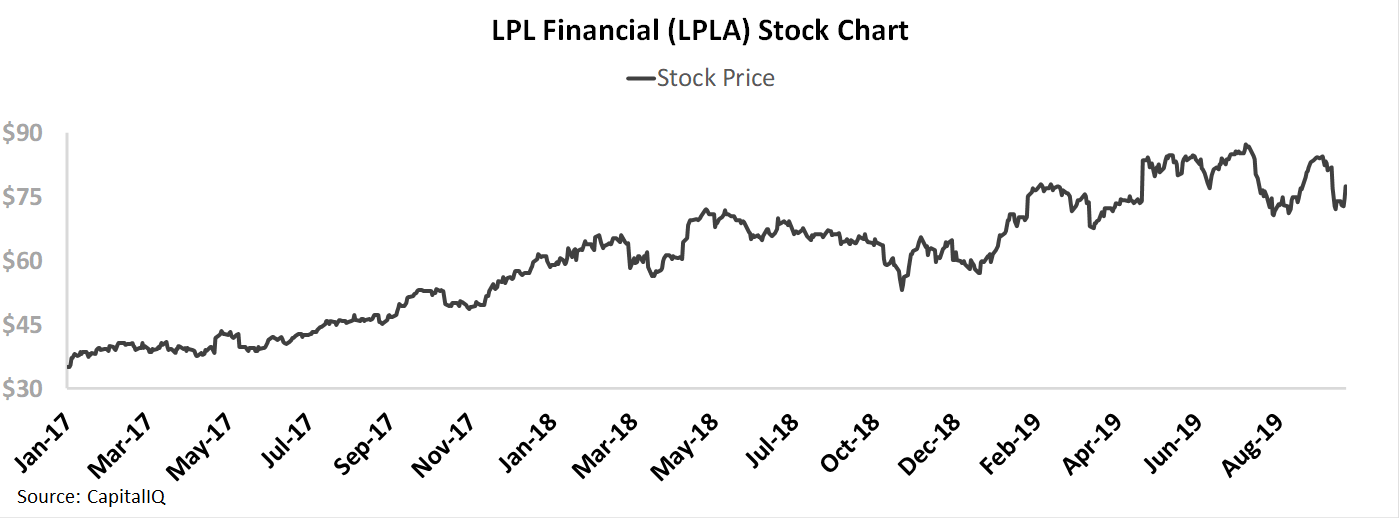
While the stock has already moved significantly, our Uniform Accounting analysis shows market expectations are still not excessive, and there may be more fundamental room for the stock to run. Not only are the fundamentals strong, but management is also showing confidence about fundamental drivers that may enable them to continue to exceed market expectations.
Event Today – Monthly Macro – Market Phase Cycle™ Release Webinar
At noon today, our Director of Research, Rob Spivey, will be hosting a webinar to review our October Market Phase Cycle™ macro analysis, which comes out at the same time.
If you’d like to register, please click here. The webinar will be 30 minutes.
On the call, Rob will be discussing what macro signals we are seeing this month, as we review our Uniform Accounting equity and credit insights, our credit cycle data, sentiment indicators, and the other systematic tools.
We have used these tools to identify key market inflections like in late 2015, early 2016, November of 2017, and this July.
We’ve repeatedly had clients tell us these webinars are the most insightful they attend, for both their investing strategy, and for helping give a cogent explanation of their macro view to clients.
I hope you can attend.
Market expectations are for Uniform ROA to decline, but management is confident about operating leverage, growth, and their pipeline
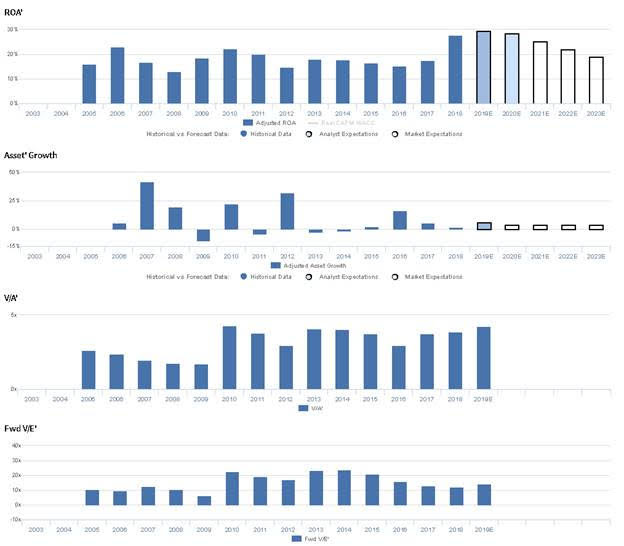
LPLA currently trades near recent lows relative to UAFRS-based (Uniform) Earnings, with a 14.3x Uniform P/E. At these levels, the market is pricing in expectations for Uniform ROA to fall from 28% in 2018 to 19% in 2023, accompanied by 4% Uniform Asset growth going forward.
Meanwhile, analysts have bullish expectations, projecting Uniform ROA to improve to 29% by 2020, accompanied by 6% Uniform Asset growth.
Historically, LPLA has seen robust, slightly cyclical profitability. Since 2005, Uniform ROA has reached cyclical peaks of 23% in 2006, 22% in 2010, 18% in 2013, and 28% in 2018. Similarly, the firm has seen cycle troughs of 13% in 2008, 15% in 2012, and 15% in 2016. Meanwhile, Uniform Asset growth has been somewhat volatile, positive in just eight of the past 13 years, while ranging from -10% to 42%.
Performance Drivers – Sales, Margins, and Turns
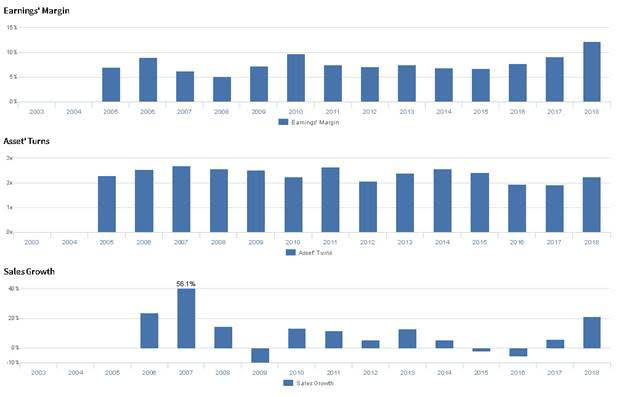
Cyclical profitability has been driven by compounding trends in Uniform Earnings Margin and Uniform Asset Turns. After declining from 9% in 2006 to 5% in 2008, Uniform Margins rebounded to 10% in 2010, before sustaining 7%-8% levels from 2011 to 2016, and improving to 12% in 2018. Meanwhile, Uniform Asset Turns improved from 2.3x in 2005 to peak 2.7x levels in 2007 before declining to 2.1x in 2012 excluding 2.7x outperformance in 2011. Thereafter, Turns expanded back to 2.6x in 2014, declined to 1.9x in 2017, and most recently rose back to 2.3x in 2018. At current valuations, markets are pricing in expectations for declines in both Uniform Margins and Uniform Turns.
Earnings Call Forensics
Valens’ qualitative analysis of the firm’s Q2 2019 earnings call highlights that management is confident total brokerage and advisory assets exceeded $700 billion for the first time, and they are confident about the strength of their product pipeline. Furthermore, they are confident they had $8.5 billion of recruited AUM in the quarter and that they delivered operating leverage. Additionally, they are confident they returned $21 million in capital from quarterly dividends, and they are confident they are focused on growing assets and gross profit.
However, management may lack confidence in their ability to achieve outcomes that lower costs and in their ability to continue driving business growth. Furthermore, they may lack confidence in their ability to strengthen their competitive position, and they may be concerned about the sustainability or recent growth in their advisory business.
UAFRS VS As-Reported
Uniform Accounting metrics also highlight a significantly different fundamental picture for LPLA than as-reported metrics reflect. As-reported metrics can lead investors to view a company to be dramatically stronger or weaker than real operating fundamentals highlight.Understanding where these distortions occur can help explain why market expectations for the company may be divergent.
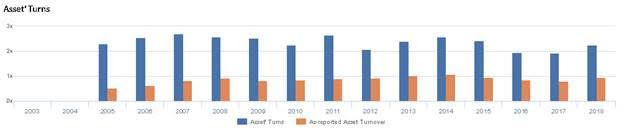
As-reported metrics significantly understate LPLA’s asset utilization, a key driver of profitability. For example, as-reported asset turnover for LPLA was 0.9x in 2018, substantially lower than Uniform Turns of 2.3x, making LPLA appear to be a much weaker business than real economic metrics highlight. Moreover, as-reported asset turnover has been less than half of Uniform Turns in each year since 2005, distorting the market’s perception of recent asset efficiency trends.
Today’s Tearsheet
Today’s tearsheet is for Walmart. Walmart trades at a premium to market average valuations. At current valuations, the market is pricing in EPS growth to be above recent trend, and P/E is above peer average levels, highlighting the high market expectations for the company.
Regards,
Joel Litman
Chief Investment Strategist


