
What’s in a number anyway?

Over the past 10 years, Pfizer has taken $21 billion in special items.
That’s more in special items over 10 years than Amazon has had in net income. It’s more than Baxter International, HCA, FedEx, and Starbucks have had in earnings either.
There are currently ~2,700 US domiciled companies in the Uniform Accounting database. If you combined the total earnings (positive and negative) over the past 10 years of the bottom 1,800 of them, they would equal less than Pfizer has taken in special items.
There’s a reason why a lot of people say that Pfizer’s CFO has no idea what its net income actually is. When you can take $700 million to $4.7 billion in special items any given year, the accruals pile up.
Any good operating accountant would tell you those reserves give a lot of room to hit numbers.
It’s why many people throw their hands up at Pfizer. It’s also why many people think that Pfizer should trade at its current low as-reported 13.9x P/E.
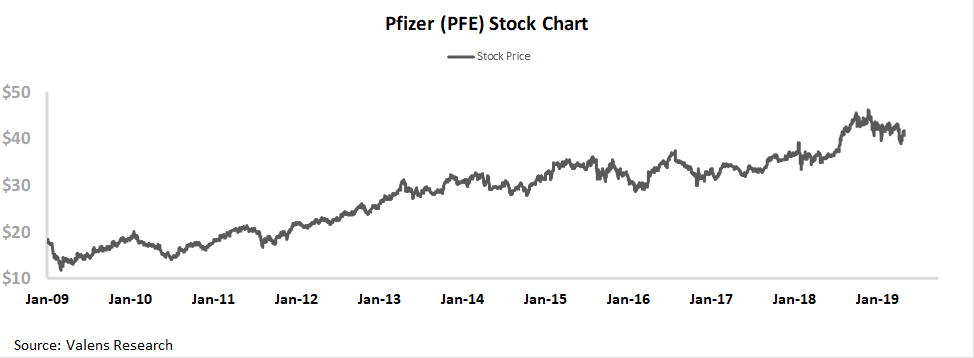
But clearly some investors understand the Pfizer is doing something right. How else would the stock double since 2009, even as net income has only risen by 30% from 2009, rising from $8.6 billion to $11.2 billion?
The reason is, when you see through the noise of Pfizer’s accounting, as Uniform Accounting can, you start to get a better handle on their fundamentals.
And we’re seeing interesting signs that mean that might accelerate going forward.
Welcome To The Valens Research Institutional Daily
Welcome to the Valens Research Institutional Daily.
We look forward to you receiving some of our most interesting insights each day from the content we’re generating across our 8,000 Uniform Accounting database.
Each day we’ll highlight one of our embedded expectations analysis that we’re sending to clients that day, sometimes replacing that with other insights from our credit, macro, and other research.
With each piece, we’ll include a little bit of extra context on what make that piece so interesting.
Lastly, we’ll be sharing one of our Valens Research equity Tearsheets with you each day. All of our dailies will be available after we email them. Our Tearsheet will only be available the day we publish it, so be sure to check in each day to see which Tearsheet we’re hosting.
Hope you enjoy our daily, and find it insightful.
Now onto the content!
Market expectations are for Uniform ROA to decline, but management is confident about the value of their M&A
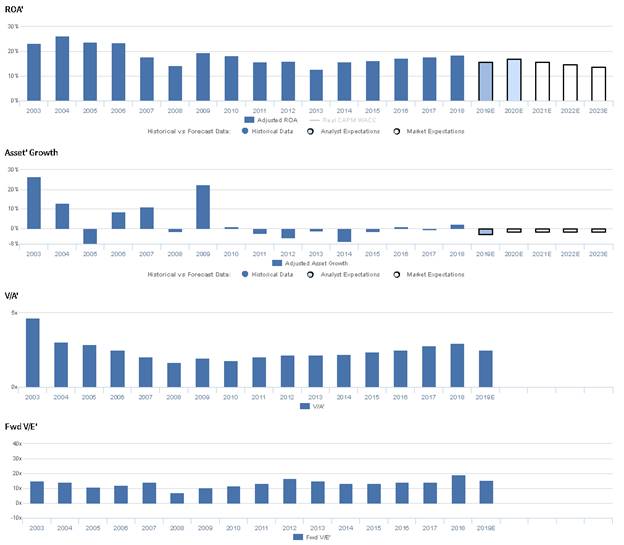
PFE currently trades near recent averages relative to UAFRS-based (Uniform) Earnings, with a 15.2x Uniform P/E. At these levels, the market is pricing in expectations for Uniform ROA to decline from 19% in 2018 to 14% in 2023, accompanied by 2% Uniform Asset shrinkage going forward.
However, analysts have less bearish expectations, projecting Uniform ROA to only decline to 17% by 2020, accompanied by 3% Uniform Asset shrinkage.
Historically, as a leading U.S. pharmaceuticals company, PFE has seen fairly robust, albeit somewhat cyclical profitability. After improving from 23% in 2003 to a high of 26% in 2004, as the firm benefitted from a broad product portfolio with minimal competition, Uniform ROA fell to 14% in 2008, as a number of the firm’s blockbuster products lost patent protection. While Uniform ROA rebounded to 20% in 2009, continued loss of exclusivity (LOE) headwinds over the following years offset the contribution of new drugs emerging out of the firm’s pipeline, driving Uniform ROA to a historical low of 13% in 2013. However, since then, Uniform ROA has gradually recovered to 19% in 2018, as the firm has benefitted from robust growth in its vaccine and nerve pain products and weaker LOE headwinds. Meanwhile, PFE has historically seen volatile Uniform Asset growth, positive in just eight of the past 16 years, while ranging from -8% to 27%, with asset shrinkage in recent years related to the divestiture of non-core assets.
Performance Drivers – Sales, Margins, and Turns
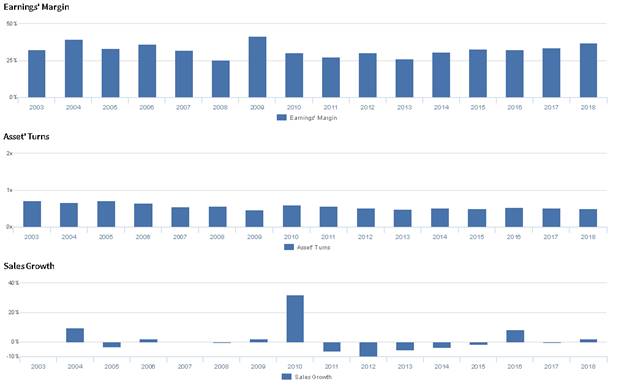
Trends in Uniform ROA have been driven primarily by trends in Uniform Earnings Margin, and to a lesser extent, Uniform Asset Turns. After improving from 33% in 2003 to 39% in 2004, Uniform Margins fell to 26% in 2008, before rebounding to a peak of 42% in 2009. However, Uniform Margins then fell to 26% in 2013, and subsequently recovered to 37% in 2018. Meanwhile, Uniform Turns, which were stable at 0.7x levels from 2003-2005, declined to 0.5x-0.6x levels from 2006-2018. At current valuations, the market is pricing in expectations for compression in Uniform Margins, coupled with stability in Uniform Turns near historical lows.
Earnings Call Forensics
Valens’ qualitative analysis of the firm’s Q2 2019 earnings call highlights that management is confident Array’s assets fit neatly into Pfizer’s existing business and that the Array deal will close in the near term. Furthermore, they are confident their Mylan deal will unlock significant shareholder value. However, they may be concerned about their ability to pursue growth opportunities in non-tender products, and they may lack confidence in their ability to drive patient growth through their strategy. Additionally, management may lack confidence in their ability to risk adjust their forecasts, and they may be concerned about further revenue declines for the Prevnar adult indication.
UAFRS VS As-Reported
Uniform Accounting metrics also highlight a significantly different fundamental picture for PFE than as-reported metrics reflect. As-reported metrics can lead investors to view a company to be dramatically stronger or weaker than real operating fundamentals highlight. Understanding where these distortions occur can help explain why market expectations for the company may be divergent.
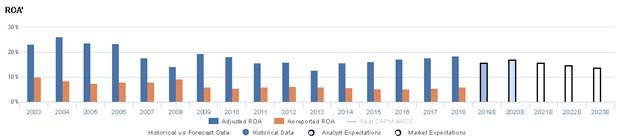
As-reported metrics understate PFE’s profitability. For example, as-reported ROA for PFE was 6% in 2018, materially lower than Uniform ROA of 19% in the same year, making PFE appear to be a much weaker business than real economic metrics highlight. Moreover, since 2013, as-reported ROA has remained at 5%-6% levels, while Uniform ROA has rebounded from a low of 13% to current 19% levels, significantly distorting the market’s perception of the firm’s recent profitability trends.
Today’s Tearsheet
Today’s tearsheet is for Microsoft. Microsoft’s UAFRS earnings growth is above average, that is above what the market is expecting for them going forward.
Regards,
Joel Litman
Chief Investment Strategist


