
This company is stuck in a sector with razor-thin returns, yet Uniform Accounting shows it’s had success differentiating from its peers

The basic materials sector usually does not have firms with sustainable levels of elevated profitability.
So unsurprisingly, looking at as-reported numbers, this specialty chemical firm has returns near cost-of-capital levels. On a closer look though, its profitability is much stronger.
Also below, Uniform Accounting Embedded Expectations Analysis and the Uniform Accounting Performance and Valuation Tearsheet for the company.
Investor Essentials Daily:
Thursday Tearsheets
Powered by Valens Research
As the name implies, the basic materials sector is relatively… basic. As such, it comes as little surprise the majority of firms in this sector never sustain returns well above the cost of capital.
This makes sense, as most of what the firms sell are not proprietary. In each of the industries in the sector, companies all follow a similar process for how they extract materials from the ground, or refine those materials, or cultivate said materials.
The process differs based on the actual material, whether it be gold, timber, aluminum and steel, stone, or others. However, within each material, most companies are completing the same task.
With so many similarities between the companies, there are limited ways to sustain a competitive advantage. Competitive advantages come from either a comparative advantage or a differential advantage.
A comparative advantage is when a firm can produce products more efficiently than its competitors. A differential advantage is when a firm’s services or products are differentiated and superior to its competitors.
Both of these advantages are difficult to attain when companies are producing generic materials.
From time to time, some companies may have returns above or below their cost of capital. However, this is usually due to short-term fluctuations in supply and demand, and it is not sustainable.
One of the few areas of the materials sector able to buck this trend and sustain high returns are companies dealing with specialty chemicals. This is because these companies can achieve a differential advantage producing proprietary chemicals. These companies have access to chemicals that cannot be copied and are branded. This allows them to charge a premium price.
One example of a specialty company is RPM International (RPM). Construction companies and everyday consumers use RPM’s products. The firm owns many brands, including Rust-Oleum, DAP, Zinsser, Stonhard, Dryvit, and Carboline.
RPM’s products have a large variety of practical uses and its brands are well respected in their respective industries. Given this, one would expect RPM has the pricing power to be able to charge a high enough price to generate solid returns.
However, according to as-reported accounting, RPM appears to have returns near cost-of-capital levels. As-reported return on assets (ROA) has declined from 7% to 6% over the past three years.
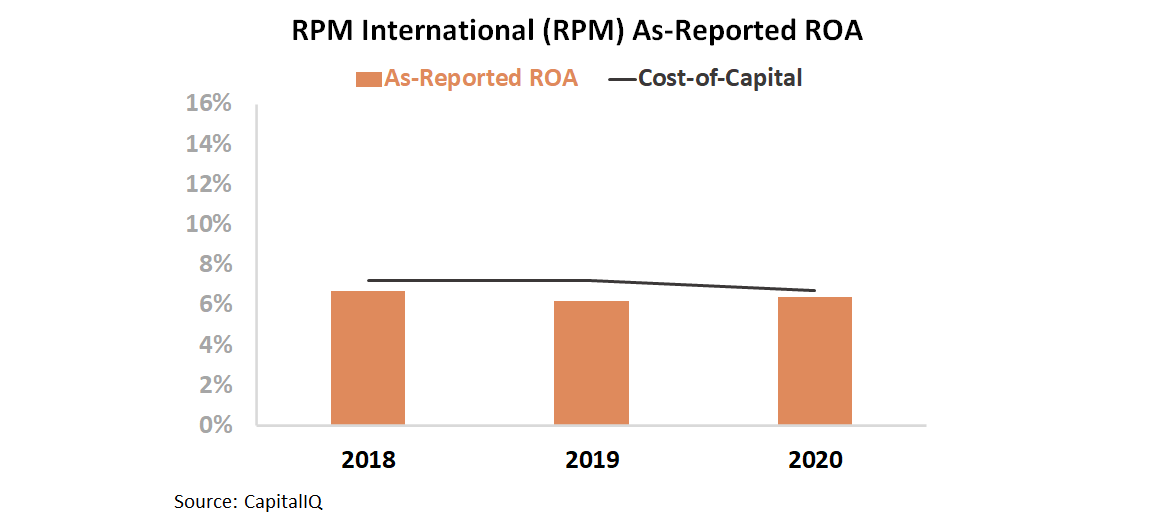
However, this picture of RPM’s performance is inaccurate, pulled down by distortions in as-reported accounting. GAAP’s treatment of goodwill and intangibles, among other distortions, are causing the market to miss the mark on RPM.
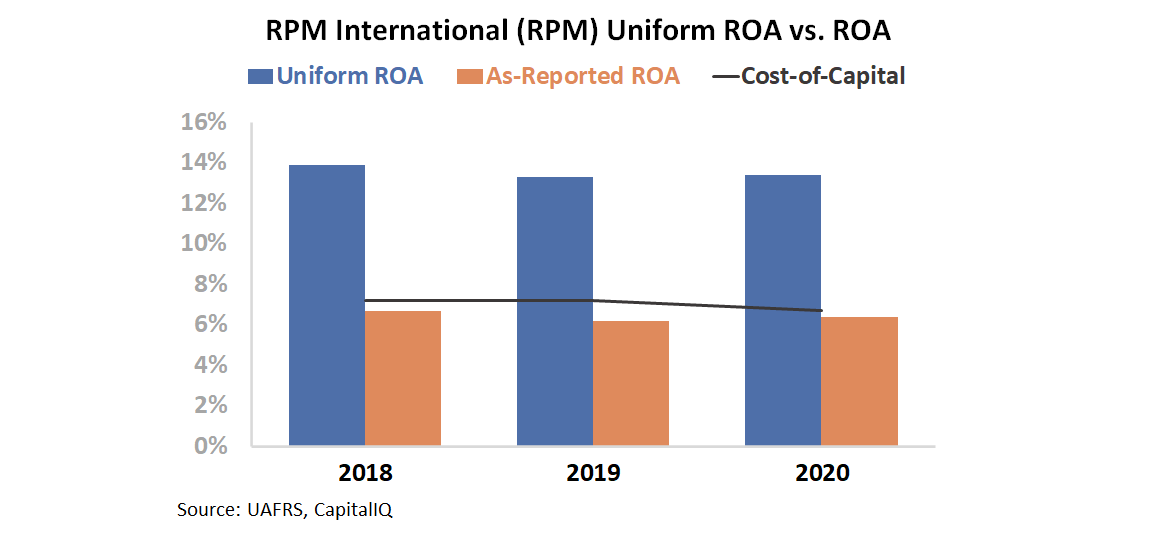
Uniform Accounting shows RPM has been able to sustain ROA far above the cost of capital. In fact, over the past three years, Uniform ROA has been roughly twice as high as the cost of capital. This year, Uniform ROA was 13% while the cost of capital was 7%.
Uniform Accounting is able to show RPM has sustained an ROA consistently above the cost of capital. However, to fully understand the stock, we need to look at the market’s expectations for RPM. To evaluate this, we can use the Embedded Expectations Framework.
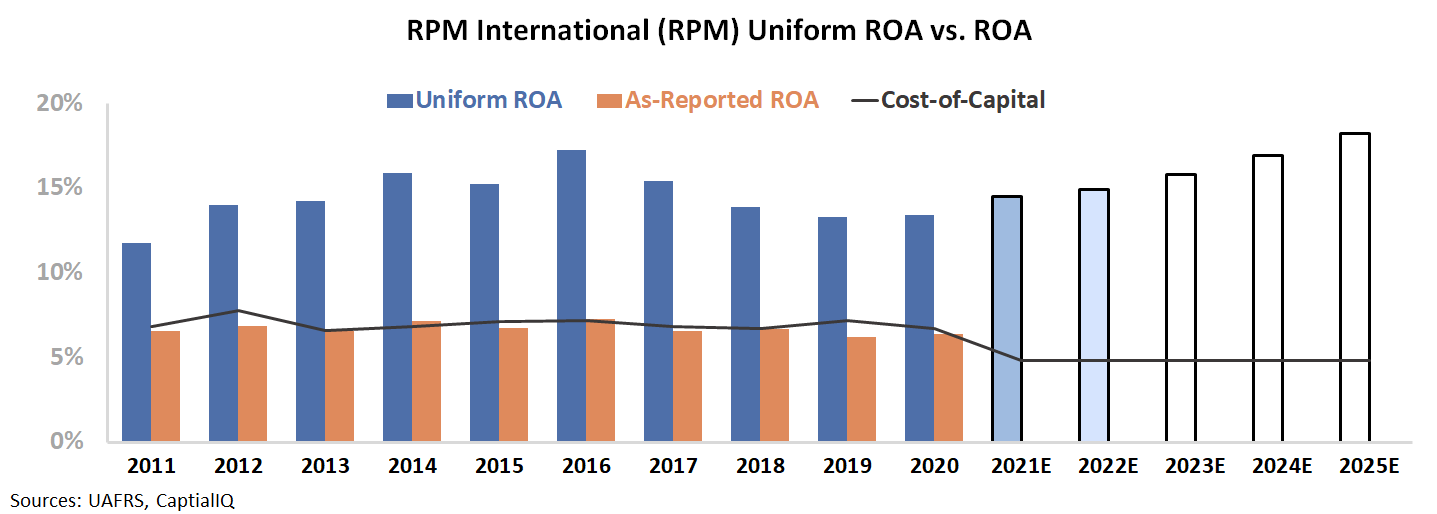
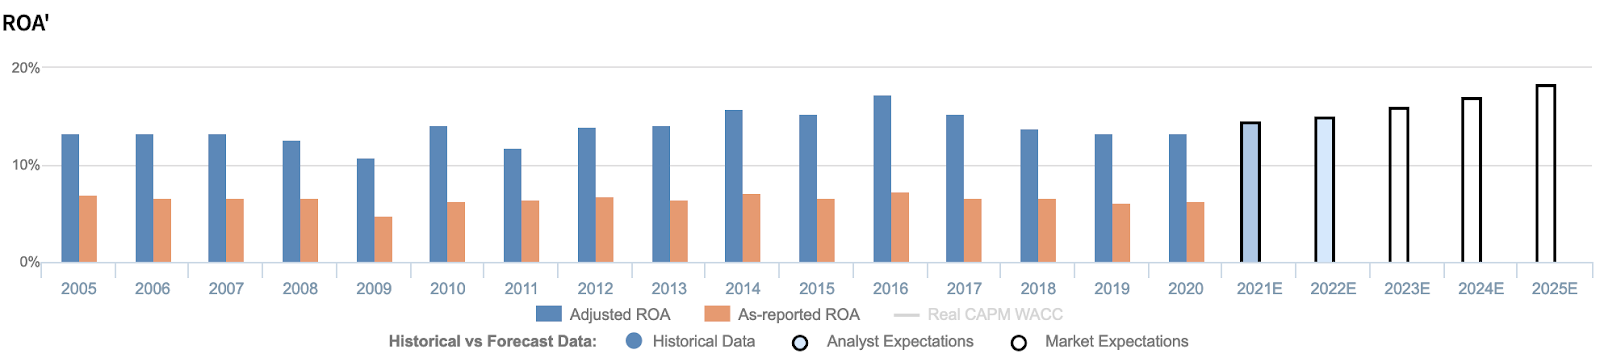
The chart below explains the company’s historical corporate performance levels, in terms of ROA (dark blue bars) versus what sell-side analysts think the company is going to do in the next two years (light blue bars) and what the market is pricing in at current valuations (white bars).
The below graph shows sell-side analysts are forecasting ROA to rise to 15% in 2022. Then, the market is pricing in improvement to continue and for ROA to reach 18% by 2025.
Although an improvement to 18% is only 5% higher than 2020 levels, it would be a profitability level the firm has never seen. Since 2011, the firm has seen relatively consistent ROA and it has never risen above 17%. It may be difficult for RPM to improve its ROA to an all-time high.
Uniform Accounting is able to show RPM has sustained a consistent and robust ROA for a decade. Now, the question is if the firm can improve profitability levels in the next five years.
Given the consistency of the materials sector, and the firm’s steady business model, it may be difficult for RPM to match the market’s expectations, even with its value-add product portfolio.
RPM International Inc. Embedded Expectations Analysis – Market expectations are for Uniform ROA to rebound, but management may have concerns about MAP to Growth, plant shutdowns, and inventory

RPM currently trades at a historical high relative to Uniform earnings, with a 26.8x Uniform P/E (Fwd V/E’). At these levels, the market is pricing in expectations for Uniform ROA to improve from 13% in 2020 to 18% in 2025, accompanied by 2% Uniform asset growth going forward.
Meanwhile, analysts have similar expectations, projecting Uniform ROA to rise to 15% in 2022, accompanied by immaterial Uniform asset shrinkage.
Historically, RPM has seen generally stable, yet recently declining, profitability. Uniform ROA sustained 13% levels from 2005-2008, before fading to 11% in 2009, amidst recessionary headwinds, and recovering to 14% in 2012. Thereafter, Uniform ROA expanded further to a peak of 17% in 2016, before contracting back to 13% levels in 2019-2020.
Meanwhile, Uniform asset growth has been somewhat consistent, positive in thirteen of the past sixteen years, while ranging from -6% to 12%.
Performance Drivers – Sales, Margins, and Turns
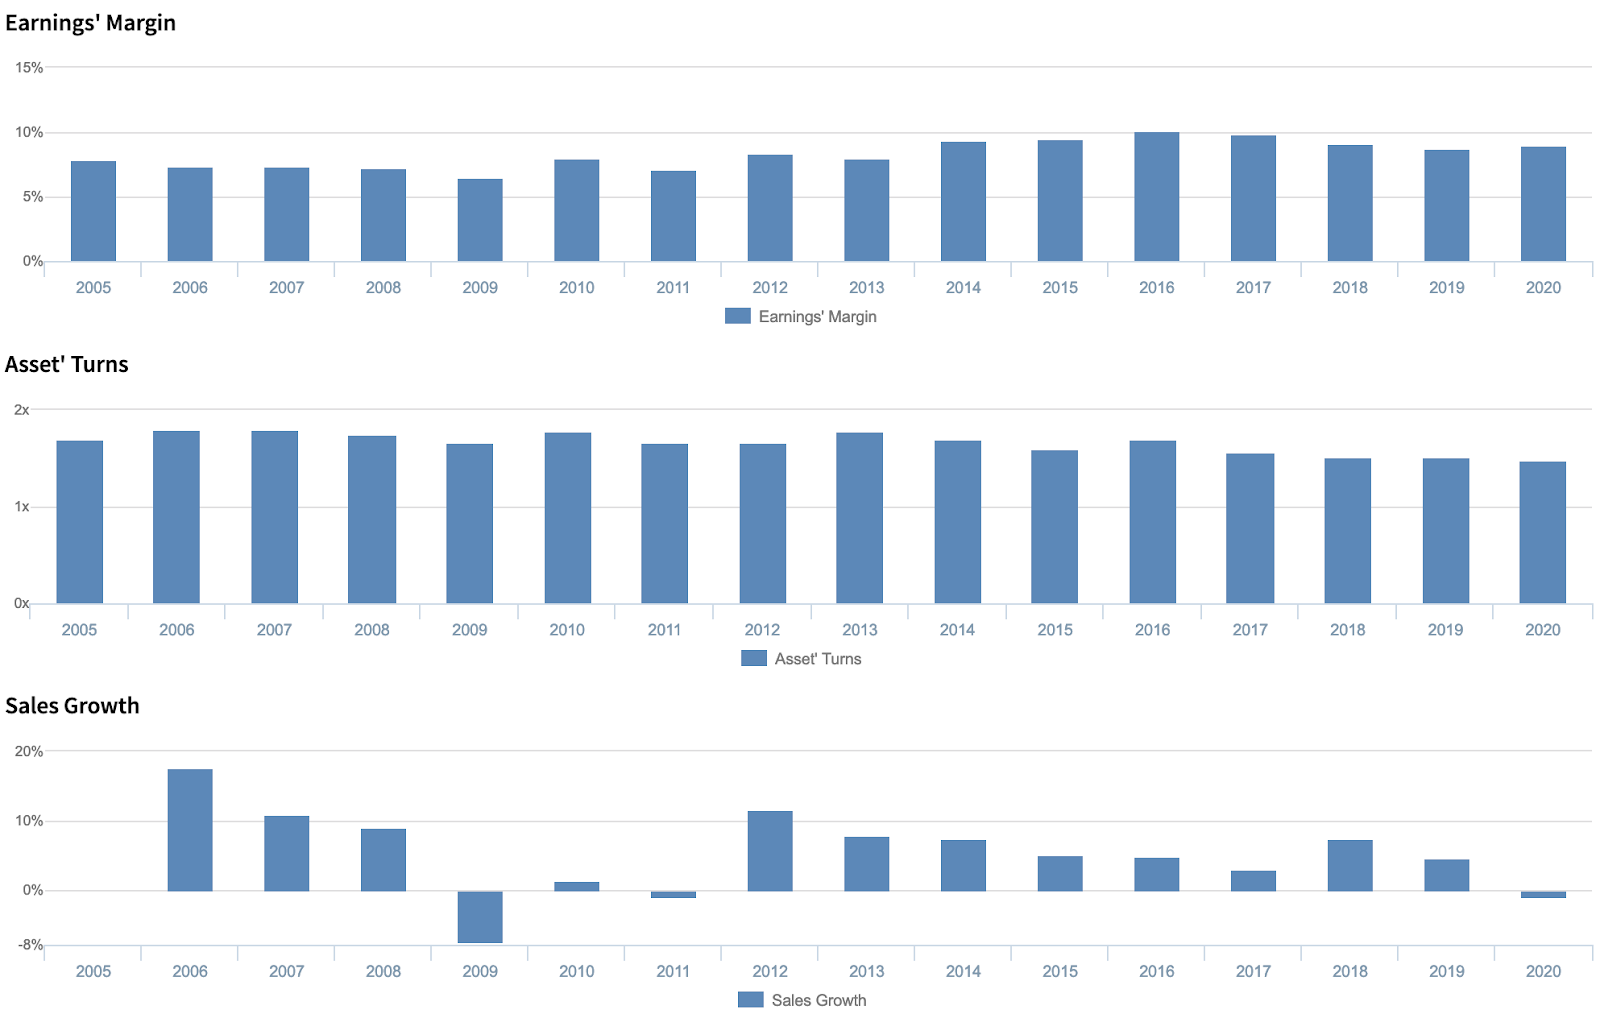
Overall stability and recent weakness in Uniform ROA have been driven by trends in both Uniform earnings margins and Uniform asset turns.
Uniform margins ranged from 7%-8% levels from 2005-2013, before improving to 10% peaks in 2015-2017 and subsequently fading to 9% levels in 2018-2020. Meanwhile, Uniform turns maintained 1.7x-1.8x levels from 2005-2014, before compressing to 1.5x levels in 2018-2020.
At current levels, markets are pricing in expectations for a reversal of recent erosion in both Uniform margins and Uniform turns.
Earnings Call Forensics
Valens’ qualitative analysis of the firm’s Q3 2020 earnings call highlights that management is confident that restrictions on construction activity in Pennsylvania were eased and that consumer behavior today is different from past economic downturns.
However, they may lack confidence in their ability to sustain plant activity improvements and execute their MAP to Growth program while trimming their 2021 capex budget. In addition, they may have concerns about the sufficiency of their inventory to cover plant shutdowns and the impact and duration of their international plant’s shutdowns.
Furthermore, they may be exaggerating the strength of their liquidity and balance sheet, the progress of their temporary hospital projects, and the safety of their facilities.
UAFRS VS As-Reported
Uniform Accounting metrics also highlight a significantly different fundamental picture for RPM than as-reported metrics reflect.
As-reported metrics can lead investors to view a company to be dramatically stronger or weaker than real operating fundamentals highlight. Understanding where these distortions occur can help explain why market expectations for the company may be divergent.
As-reported metrics significantly understate RPM’s profitability.
For example, as-reported ROA for RPM was 6% in 2020, materially lower than Uniform ROA of 13%, making RPM appear to be a much weaker business than real economic metrics highlight.
Moreover, since 2016, as-reported ROA has remained at 6%-7% levels through 2020, while Uniform ROA has fallen from 17% to 13% over the same time frame, directionally distorting the market’s perception of the firm’s recent profitability trends.
SUMMARY and RPM International Inc. Tearsheet
As the Uniform Accounting tearsheet for RPM International Inc. (RPM:USA) highlights, the Uniform P/E trades at 26.8x, which is above the global corporate average valuation levels and its historical average valuations.
High P/Es require high EPS growth to sustain them. In the case of RPM, the company has recently shown an 6% growth in Uniform EPS.
Wall Street analysts provide stock and valuation recommendations that in general provide very poor guidance or insight. However, Wall Street analysts’ near-term earnings forecasts tend to have relevant information.
We take Wall Street forecasts for GAAP earnings and convert them to Uniform earnings forecasts. When we do this, RPM’s Wall Street analyst-driven forecast is a 13% and 8% EPS growth in 2021 and 2022, respectively.
Based on the current stock market valuations, we can use earnings growth valuation metrics to back into the required growth rate to justify RPM’s $83 stock price. These are often referred to as market embedded expectations.
In order to justify current stock prices, the company would need to have Uniform earnings grow by 7% per year over the next three years. What Wall Street analysts expect for RPM’s earnings growth is above what the current stock market valuation requires in 2021 and 2022.
Furthermore, the company’s earning power is 2x corporate average. Also, cash flows and cash on hand are above their total obligations—including debt maturities, capex maintenance, and dividends. Together, this signals low credit and dividend risk.
To conclude, RPM’s Uniform earnings growth is above peer averages, and the company is trading around its average peer valuations.
Best regards,
Joel Litman & Rob Spivey
Chief Investment Strategist &
Director of Research
at Valens Research


