
This Company’s P/E Masks How Cheap It Really Is

Last Tuesday, we wrote a Valens Research Institutional Daily on Ford, where we highlighted how rare it is for a company to trade at a material discount to their asset base, when it’s cleaned up to remove the accounting noise under Uniform Accounting.
There’s a simple reason for that. Once a company’s returns drop well below its cost of capital, the company stops trading on its cash flows. A high P/E for a low ROA company is not a reason to sell or short the stock, it’s a reason to note that the market is no longer valuing the company based on cash flows.
Exxon (XOM) currently trades at a 52.5x Uniform P/E and Chevron (CVX) currently trades at a 92.2x P/E. The market is not paying a massive premium to market average multiples for companies with Uniform ROA of 1%, which both have. The market is just valuing these companies off of another variable.
That market is valuing Exxon and Chevron based on their adjusted asset base. For companies with low profitability, valuing them off their asset base makes sense.
Even if a company is not generating a robust return, the company’s assets have some worth. Either the plant and equipment could be sold for parts and scrapped, the inventory has intrinsic value, the company’s accounts receivables could be financed.
For Exxon and Chevron, they have massive oil and gas reserves that are either producing, proven, or probable reserves. Even if oil and gas prices are low now, suppressing their profitability, in the future prices may be higher. There is also value for other oil & gas companies that those assets have already been found.
Range Resources (RRC) is in a similar position as Exxon and Chevron. They are trading at a 55x Uniform P/E, but a 0.6x Uniform P/B.
They are an oil & gas E&P company, with 12,000 bcfs of natural gas reserves. As of end of year 2018, the company’s value of their proved reserves was $13.2 billion, but the company’s Uniform Enterprise Value, the value of all the company’s equity and debt in the market, was $5.3 billion. The company is trading at a significant discount to their reserve values, let alone their total asset base.
The market is valuing Range Resources like they’ll never be able to earn a fraction of the value of their reserves. That likely places a floor on Range Resources’ valuations, which limits downside, much like it did for Ford. And with Range Resources not worried about credit risks, that could justify a discount to asset values. In fact, they’re confident about their liquidity, capital allocation strategy, and their ability to control costs and improve profitability. There may be potential for equity upside.
Market expectations are for Uniform ROA to remain muted, but management is confident about their liquidity, costs, and capital allocation
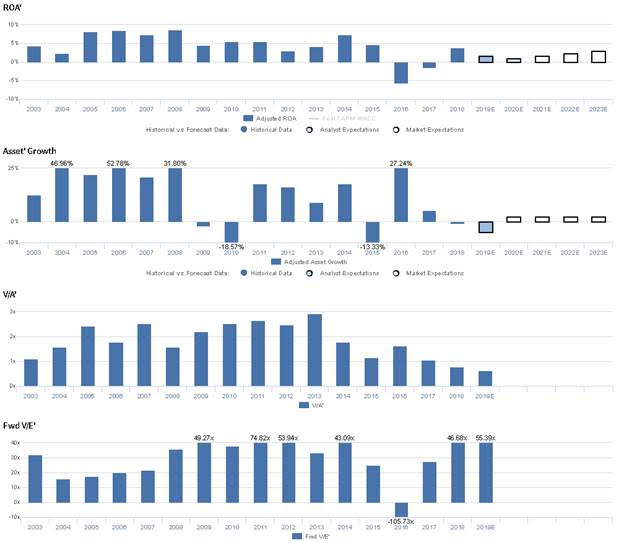
RRC currently trades at a historical low relative to UAFRS-based (Uniform) Assets, with a 0.6x Uniform P/B. At these levels, the market is pricing in expectations for Uniform ROA to fade from 4% in 2018 to 3% by 2023, accompanied by 2% Uniform Asset growth going forward.
However, analysts have even more bearish expectations, projecting Uniform ROA to decline to 1% by 2020, accompanied by 5% Uniform Asset shrinkage.
Historically, RRC has seen muted profitability. After falling from 4% in 2003 to 2% in 2004, following their entry into the Marcellus Shale in 2004, Uniform ROA expanded to 7%-9% levels through 2008, before falling to 3% in 2012, and rebounding to 7% in 2014. Thereafter, driven by a steep drop in oil prices, Uniform ROA collapsed to -6% in 2016, before inflecting positively to 4% in 2018. Meanwhile, Uniform Asset growth has been somewhat consistent, positive in 12 of the last 16 years, and ranging from -19% to 53%.
Performance Drivers – Sales, Margins, and Turns
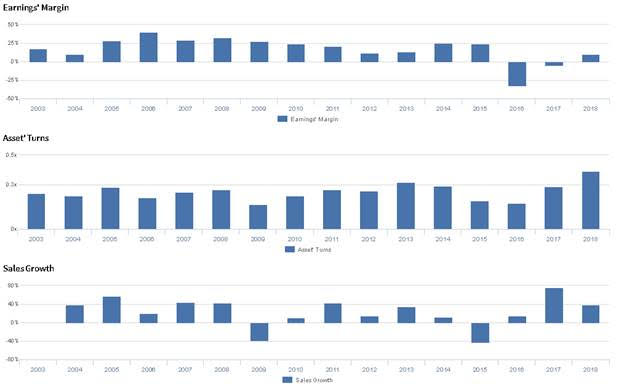
Cyclicality in Uniform ROA has been driven by trends in both Uniform Earnings Margin and Uniform Asset Turns. After falling from 18% in 2003 to 10% in 2004, Uniform Margins improved to a peak of 40% in 2006, before steadily falling to 12% in 2012. Thereafter, Uniform Margins rebounded to 25% in 2014, before collapsing to -32% in 2016, and rebounding to 10% in 2018. Meanwhile, Uniform Turns ranged from 0.2x-0.3x from 2003-2017, before expanding to a peak of 0.4x in 2018. At current valuations, the market is pricing in expectations Uniform Margins to remain near current levels, and for Uniform Turns to reverse their recent improvements.
Earnings Call Forensics
Valens’ qualitative analysis of the firm’s Q3 2019 earnings call highlights that management generated excitement markers when discussing the amount of liquidity they have available and when saying they are going to be opportunistic when executing their share repurchase program. Furthermore, they are confident they have improved their vehicle safety program and that GP&T costs are consistent with guidance. Moreover, they are confident they intend to finish the year with capital spending below budget and that their share repurchase program is valuable to shareholders. Additionally, they are confident Range’s class-leading cost per foot and shallow base decline help support low and sustainable maintenance capital requirements.
However, management may lack confidence in their ability to continue driving down capital requirements, sustain frac stage deployment, and forecast 2020 inventory generation. Furthermore, they may be concerned about the sustainability of operating cost declines, and they may lack confidence in their ability to sustain improvements in completion costs. Finally, they may lack confidence in their ability to continue increasing their credit facility commitments and in their ability to favorably refinance in the near future.
UAFRS VS As-Reported
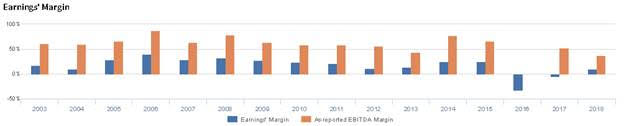
Uniform Accounting metrics also highlight a significantly different fundamental picture for RRC than as-reported metrics reflect. As-reported metrics can lead investors to view a company to be dramatically stronger or weaker than real operating fundamentals highlight. Understanding where these distortions occur can help explain why market expectations for the company may be divergent.
As-reported metrics significantly overstate RRC’s margins, one of the main drivers of profitability. For example, as-reported EBITDA margin for RRC was 38% in 2018, materially higher than Uniform Earnings Margin of 10%, making RRC appear to be a much stronger business than real economic metrics highlight. Moreover, since 2003, as-reported EBITDA margin has been more than twice Uniform Margin in almost every year, distorting the markets perception of the firm’s historical margin ceiling.
Today’s Tearsheet
Today’s tearsheet is for McDonald’s. McDonald’s trades at a significant premium to market average valuations. The company has recently had Uniform EPS growth around 5%, and EPS growth is forecast to continue at these rates going forward. At current valuations, the market is similarly pricing in the company having around 5% earnings growth going forward. The company’s earnings growth for 2019 is slightly below peer average levels, and the company is trading at peer average valuations. The company has above average returns, with no risk to their dividend.
Regards,
Joel Litman
Chief Investment Strategist


