
Shorting Is Not About Valuations, This Company Is Proof

We often get the question from clients “so if I just reverse your long screen, is that what you’d recommend as a short?”
And our answer is always a very quick “no, shorting is much different.”
With long idea generation, we can often start with valuation and performance, and then wait for the market to catch on. The market is upwards-biased, rising over two thirds of the time, and thanks to the strength of the power of Uniform earnings growth (or Uniform earning power if you will), stocks tend to rise if they’re undervalued.
But stocks that are “overvalued” on value screens often aren’t short candidates. They’re just stocks with phenomenal earnings growth that the market is paying a premium for, because aggressive earnings growth is hard to find.
Just because Salesforce.com (CRM) is trading at a 55x Uniform P/E doesn’t make it a short, if the company can produce the earnings growth to justify that valuation.
There is a term in the industry for people who short based on valuation alone and lose a lot of money–it’s called “getting your face ripped off.”
Graphic, we know, but it helps explain how terrifying shorting a high growth stock is because it is “expensive.”
To get a short right, you don’t look for valuation, you look for a catalyst, something that is causing the company to breakdown that the market is not pricing in.
If you just short on valuation alone, you can end up shorting a company whose stock chart looks like this. Only you’re shorting at the beginning of the stock chart in early 2016.
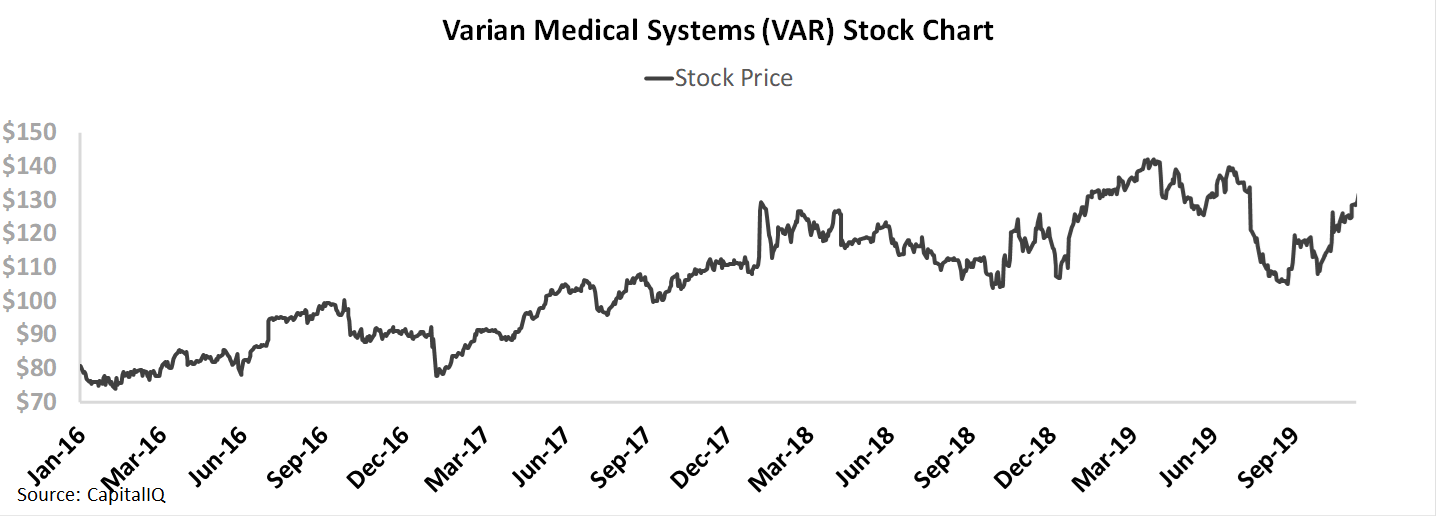
In early 2016, Varian Medical Systems (VAR) had a 33x Uniform P/E, well above corporate averages. In 2015, the company had seen Uniform ROA fall from 18% to 11% levels. You might have looked at this company and saw a company that had high valuations and was breaking down.
In reality, you were shorting a company that was just seeing an inflection in their core Oncology Systems business, where they make hardware and software for radiotherapy treatments for cancer. They had just invested significantly in the business, and their product suite was about to ramp.
By screening on valuation, you would have missed the catalyst, which was in the opposite direction for Varian–the business was accelerating.
Anyone looking at Varian now might also look at it as a compelling short. Uniform P/E is at 26x, and the market is pricing the company to have Uniform ROA reach an all-time peak over the next few years, rising from 18% in 2019 to 27% by 2024. Considering how high expectations are, the stock must have to fall, right?
Not necessarily, and not if fundamental momentum is still offering a tailwind for the company.
For Varian, the company still appears to have very strong tailwinds. Not only are they executing well, hence why Uniform ROA has risen from 11% in 2015 to 18% in 2019, but management is confident about their acquisition strategy, their overall growth initiatives, their revenue trends, and the business overall. This is a company that is continuing to execute, and is likely to see returns continue to expand.
At worst, Varian is a walk away, the market has this company right and it is fairly valued right here most likely. Varian could even be a long if they continue executing and driving earnings growth. The P/E will stay the same, but earnings can keep rising, driving the stock price higher too. But it is definitely not a short, because valuation alone doesn’t make for a winning short.
Market expectations are for Uniform ROA expansion, and management is confident about their acquisitions, revenue, and growth
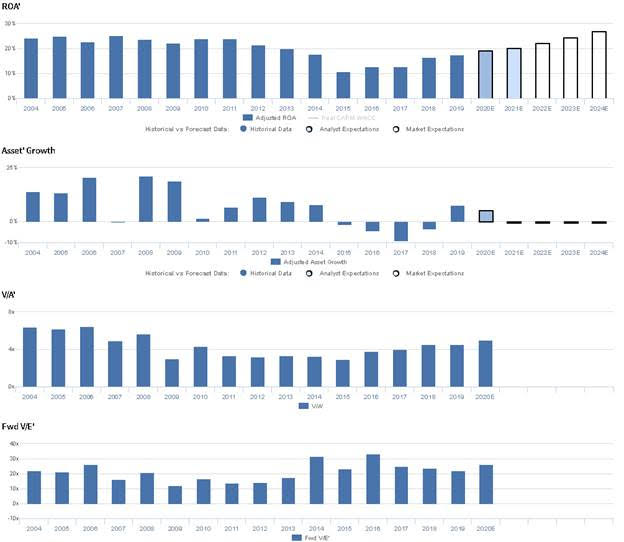
VAR currently trades above corporate averages relative to UAFRS-based (Uniform) Earnings, with a 26.3x Uniform P/E. At these levels, the market is pricing in expectations for Uniform ROA to improve from 18% in 2019 to 27% in 2024, accompanied by 1% Uniform Asset shrinkage.
Analysts have similar expectations, projecting Uniform ROA to improve to 20% through 2021, accompanied by 5% Uniform Asset growth.
VAR has historically seen cyclical, generally declining profitability. Uniform ROA sustained 23%-25% levels in 2004-2008, before fading to 22% in 2009. Thereafter, Uniform ROA rebounded to 24% levels from 2010-2011, before declining to 11% in 2015, and most recently improving to 18% in 2019. Meanwhile, Uniform Asset growth has been volatile, positive in just 11 of the past 16 years, while ranging from -9% to 21%.
Performance Drivers – Sales, Margins, and Turns
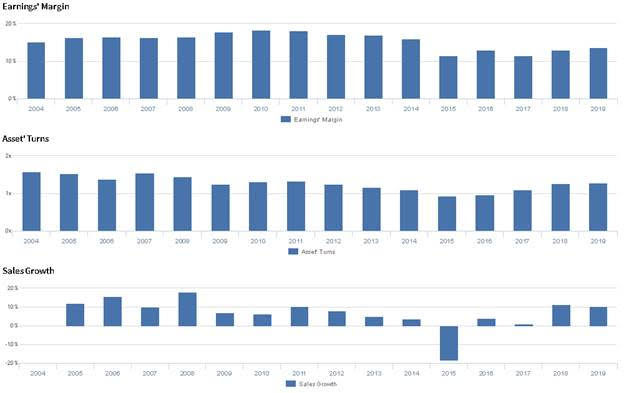
Cyclicality in Uniform ROA has been driven by trends in both Uniform Earnings Margin and Uniform Asset Turns. After expanding from 15% in 2004 to 18% in 2010, Uniform Margins declined to 12% in 2015, before rebounding to 14% in 2019. Meanwhile, Uniform Turns contracted from 1.6x in 2004 to 0.9x in 2015, before improving again to 1.3x in 2019. At current valuations, markets are pricing in expectations for both Uniform Margins and Uniform Turns to continue expanding.
Earnings Call Forensics
Valens’ qualitative analysis of the firm’s Q4 2019 earnings call highlights that management is confident they are focusing on four strategic enablers for their patients, and they are confident that the Karolinska University Hospital has begun testing their Bravos afterloader. Furthermore, they are confident Noona will reach 22,000 new cancer cases per year and that they can grow their revenue between 9% and 12% in 2020. Finally, they are confident their software business is positioned for growth in developed and developing markets, and they are confident their recent acquisitions have performed well.
However, management may lack confidence in their ability to sustain recent operating earnings improvement, and they may be exaggerating their competitive moats in the radiation therapy space. Furthermore, they may be concerned about the timing of their FLASH product to enter widespread treatment and about their market share in Japan and China.
UAFRS VS As-Reported
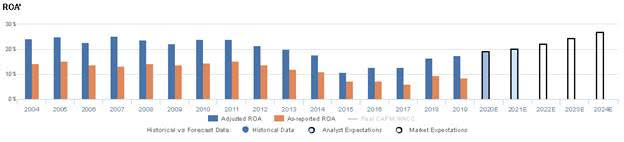
Uniform Accounting metrics also highlight a significantly different fundamental picture for VAR than as-reported metrics reflect. As-reported metrics can lead investors to view a company to be dramatically stronger or weaker than real operating fundamentals highlight. Understanding where these distortions occur can help explain why market expectations for the company may be divergent.
As-reported metrics significantly understate VAR’s profitability. For example, as-reported ROA for VAR was 9% in 2019, substantially lower than Uniform ROA of 18%, making VAR appear to be a much weaker business than real economic metrics highlight. Moreover, as-reported ROA has consistently been below Uniform ROA since 2004, distorting the market’s perception of the firm’s profitability ceiling.
Today’s Tearsheet
Today’s tearsheet is for United Technologies. United Technologies trades around market average valuations. The company has recently had slightly negative Uniform EPS growth at -1%. EPS growth is forecast to improve to 32% in 2019, and 17% in 2020. At current valuations, the market is pricing the company to see earnings grow by 6% a year going forward.
The company’s earnings growth is forecast to be above peers in 2019, but company is trading at peer average valuations. The company has corporate average returns, and no cash flow risk to their dividend.
Regards,
Joel Litman
Chief Investment Strategist


