
This company Is in Trench Warfare, but Is Priced Like It Is an Arms Dealer

Often in finance we talk about companies either being “pick axe sellers” or “arms dealers”, and people being “gold miners” or people in the middle of a “war.”
The idea is that in a massive growing market, there will be a lot of competition. Being a member of that growth market is great, if you win, but if you don’t win, you could be wiped out. On the other hand, if you’re a supplier to that market, no matter who wins, you make more money as the market continues to grow massively.
The classic example of this is Levi Strauss. Levi Strauss was a seller of pick axes, jeans, and many other things for mining companies. No matter which miners were successful, Levi Strauss would make money, as long as people were buying mining supplies.
There’s a reason you likely don’t know the name of any miner, or mining company, that prospected in California in 1849. But you almost certainly know the name Levi Strauss.
Square (SQ) is a company that is currently priced for massive growth and expansion in their returns.
With the continued growth of the cashless economy, Square is priced to be an arms dealer in this transition. They are helping smaller businesses that did not used to be able to afford to take credit card payments to do so, empowering them to grow.
But here’s the issue, Square isn’t the only company doing this. There are plenty of competitors in the point of sale (POS) payment business, including PayPal Here, SumUp, Intuit GoPayment, PayAnywhere and Clover Go, just to name a few. It is a growing market, that Square helped create, but it is a highly competitive market too.
Square is in the middle of trench warfare, or if you prefer another analogy, they are the miners using pick axes.
The real arms dealers or pick axe sellers in this market are Mastercard, Visa, American Express, and Discover, the network providers. They supply the network that all these POS suppliers are using to be able to connect businesses and customers. They are the companies that win no matter whose POS system gets used.
Square is being priced like one of the network providers, when they are anything but. The market is expecting the company to continue grow massively while also seeing returns scale massively as they get stronger economies of scale. However, management is showing concerns about cross selling, their competitive moat, and customer retention, that signal reasons to think the market is too optimistic about their growth going forward.
Market expectations are for Uniform ROA expansion, but management may be concerned about cross selling, their competitive moat, and customer retention
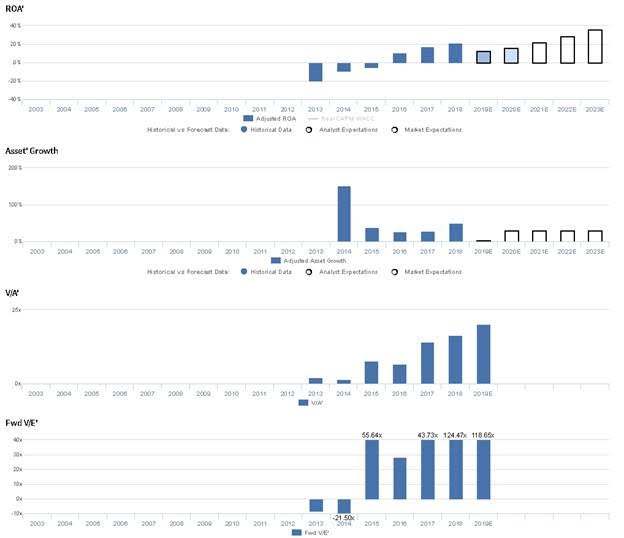
SQ is currently trading near historical highs relative to UAFRS-based (Uniform) Earnings, with a 118.7x Uniform P/E. At these levels, the market is pricing in expectations for Uniform ROA to improve from 21% in 2018 to 36% by 2023, accompanied by 30% Uniform Asset growth going forward.
However, analysts have relatively bearish expectations, projecting Uniform ROA to sink to 16% through 2020, accompanied by 4% Uniform Asset growth.
Historically, SQ has seen consistently improving profitability, with Uniform ROA inflecting positively from -20% in 2013 to 11% by 2016, before reaching a high of 21% in 2018. Meanwhile, Uniform Asset growth has been robust, as the firm is still in its early stages, with annual growth exceeding 26% in each of the past five years, and most recently reaching 51% in 2018.
Performance Drivers – Sales, Margins, and Turns
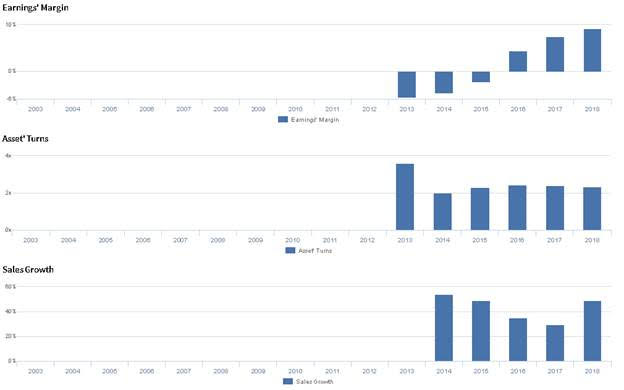
Improvements in profitability have been driven largely by improving Uniform Earnings Margin, coupled with stable Uniform Asset Turns. Uniform Margins have steadily improved in each year since SQ’s IPO, from -6% in 2013 to a historical high of 9% in 2018. Meanwhile, Uniform Turns fell sharply, from 3.6x in 2013 to 2.0x in 2014, driven by substantial growth of the firm’s Uniform Asset base, but have since stabilized at 2.3x-2.4x levels through 2018. At current valuations, markets are pricing in expectations for further Uniform Margin expansion, coupled with stable Uniform Turns.
Earnings Call Forensics
Valens’ qualitative analysis of the firm’s Q3 2019 earnings call highlights that management is confident CashApp has seen margin expansion in each of the past three years. However, they may lack confidence in their ability to cross sell their products to vendors, and they may be exaggerating the value of the network effect from their products. Furthermore, they may lack confidence in their ability to develop their competitive moat and retain customers in their CashApp products.
UAFRS VS As-Reported
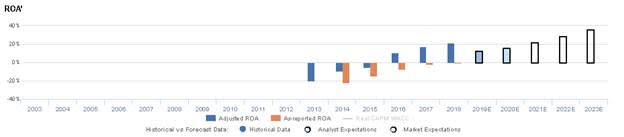
Uniform Accounting metrics also highlight a significantly different fundamental picture for SQ than as-reported metrics reflect. As-reported metrics can lead investors to view a company to be dramatically stronger or weaker than real operating fundamentals highlight. Understanding where these distortions occur can help explain why market expectations for the company may be divergent.
As-reported metrics significantly understate SQ’s profitability. For example, as-reported ROA for SQ was -1% in 2018, materially lower than Uniform ROA of 21%, making SQ appear to be a much weaker business than real economic metrics highlight. Moreover, negative as-reported ROA implies SQ has yet to become a profitable firm, while Uniform ROA shows SQ’s profitability has inflected positively to far above corporate average levels, distorting the market’s perception of the firm’s historical profitability trends.
Today’s Tearsheet
Today’s tearsheet is for NVIDIA. NVIDIA trades at a significant premium to market average valuations. The company has recently had impressive Uniform EPS growth, at around 23%. EPS growth is forecast to flip negatively in 2020 before accelerating rapidly again in 2021. At current valuations, the market is pricing the company to see earnings grow going forward.
The company’s earnings growth for 2020 is at the low end of peer average levels, but the company is also trading at well above peer average valuations. The company has robust returns, and no cash flow risks.
Regards,
Joel Litman
Chief Investment Strategist


