
This company’s risk on a new business model unlocked value across its industry, but Uniform metrics show it would need a repeat to justify upside.

This company was the test case for a brand new business model that transformed its market.
After its success, its competitors have piled into the business model too, leading to significant expansion in returns for many of the companies in the industry. However, looking at as-reported metrics, it’s not clear why competitors followed suit.
Only when looking at TRUE Uniform metrics is it clear why investors followed suit—the strategy massively expanded the company’s returns.
Only now, the company would need to duplicate the strategy to satisfy market expectations, which it may struggle to do.
Also below, Uniform Accounting Embedded Expectations Analysis and the Uniform Accounting Performance and Valuation Tearsheet for the company.
Investor Essentials Daily:
Thursday Tearsheets
Powered by Valens Research
In November, we wrote about Microsoft, highlighting how the company’s acceleration above a $1 trillion market cap has been empowered by them following in the footsteps of Adobe.
Adobe was the first of the big software companies to go through the transition from a software sales model to a software subscription model. While that strategy can lead to rocky returns initially, if executed correctly it can lead to a massive ramp in returns.
You can read the whole story about how transformational the strategy was in the November article.
Adobe’s strategy was so successful, and so many other software companies have attempted to replicate it, that in the investment world, and the software world, most people immediately understand what you’re saying when you say a company is “going through the Adobe” conversion. It gets people excited.
But the success of Adobe’s strategy, and the risk Adobe was taking when they undertook their conversion, is only apparent when the accounting is cleaned up.
The chart below will be common to regular readers of the Investor Essentials, or readers of our other analysis here at Valens. The orange bars represent the distorted as-reported GAAP return on assets (ROA) for Adobe historically. The dark blue bars represent the Uniform Accounting (UAFRS) adjusted ROA of the company historically.
The light blue bars are what consensus estimates forecast Uniform ROA to be for the next 2 years, and importantly, the white bars are what the market is pricing in.
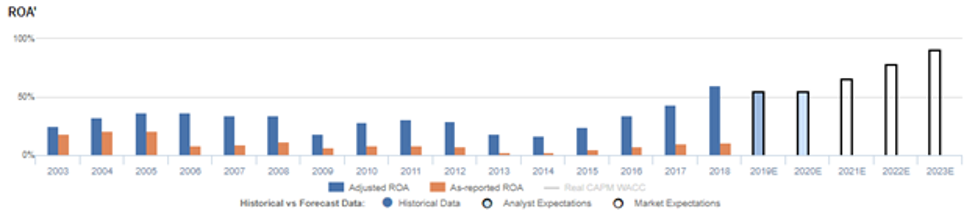
Looking at the as-reported ROA, it looks like the company was only generating a pedestrian 9% ROA, as though the company wasn’t risking much by taking on a new strategy.
But Adobe had a Uniform ROA of 31% in 2011, the year before the company began its strategy shift. That is a very robust return in any industry, including software. If management had destroyed a business that robust with this shift, they would have become infamous.
As importantly, as-reported ROA misrepresent how successful the company has been since. On an as-reported basis, ROA is barely above 2011 levels currently, at 10%.
If the business improvement was that modest from such a massive strategy change, it is unlikely anyone would be rushing to copy Adobe’s strategy. So why has this strategy become such a hugely powerful model others are adopting?
Because the rest of the industry realizes what Uniform Accounting is showing. After accounting distortions are removed, Uniform ROA almost doubled from 2011 to 2018.
Uniform earnings have grown even more, since the company has also been investing. Uniform earnings has risen from $1.3 billion to $3.3 billion, rising over 150%. Only through looking at Uniform Accounting can investors see the same type of insights these tech companies are seeing when they’re making these transformational shifts.
Adobe’s transition has been truly impressive. However, there is another datapoint the chart above shows—what the market is expecting the company to do going forward.
Adobe’s ROA has risen from 31% in 2011 to 60% in 2018. But for the company to be fairly valued, it needs to see Uniform ROA rise to 95%, and the company needs to keep growing, at 7% a year.
Basically, Adobe needs to see its earnings double in the next 5 years to not disappoint the market right now. Uniform Earnings would need to reach around $6.9 billion.
While market expectations are exceptionally high, management appears to be growing less optimistic about their outlook. Management appears concerned about sustaining growth and about end market demand. They also may not be confident about their products’ competitive positioning.
Adobe Embedded Expectations Analysis – Market expectations are for record Uniform ROA expansion, but management may be concerned about growth, demand, and their products

ADBE currently trades above recent averages relative to UAFRS-based (Uniform) Earnings, with a 38.6x Uniform P/E. At these levels, the market is pricing in expectations for Uniform ROA to improve from 60% in 2018 to a record high 95% in 2023, accompanied by 7% Uniform Asset growth.
However, Wall Street analysts have somewhat bearish expectations. Their earnings forecasts, converted to Uniform numbers, project Uniform ROA to decline to 55% through 2020, accompanied by 15% Uniform Asset growth.
As a software company with a focus on multimedia and creativity software products, a highly discretionary segment, ADBE has historically seen cyclical profitability. There have been three identifiable cycles in the last 16 years, with Uniform ROA gradually reaching lower troughs, from 25% in 2003 to 19% in 2009 and 16% in 2014. Meanwhile, Uniform ROA reached cycle-peaks of 37% in 2006, 31% in 2011, and 60% most recently in 2018. Recent outperformance has been driven by the firm’s continued expansion into marketing and cloud services, end markets that are experiencing substantial tailwinds, and driving a secular, rather than cyclical shift upwards in profitability. Meanwhile, Uniform Asset growth has been consistent, positive in each of the past 16 years, while ranging from 0%-28%.
Performance Drivers – Sales, Margins, and Turns
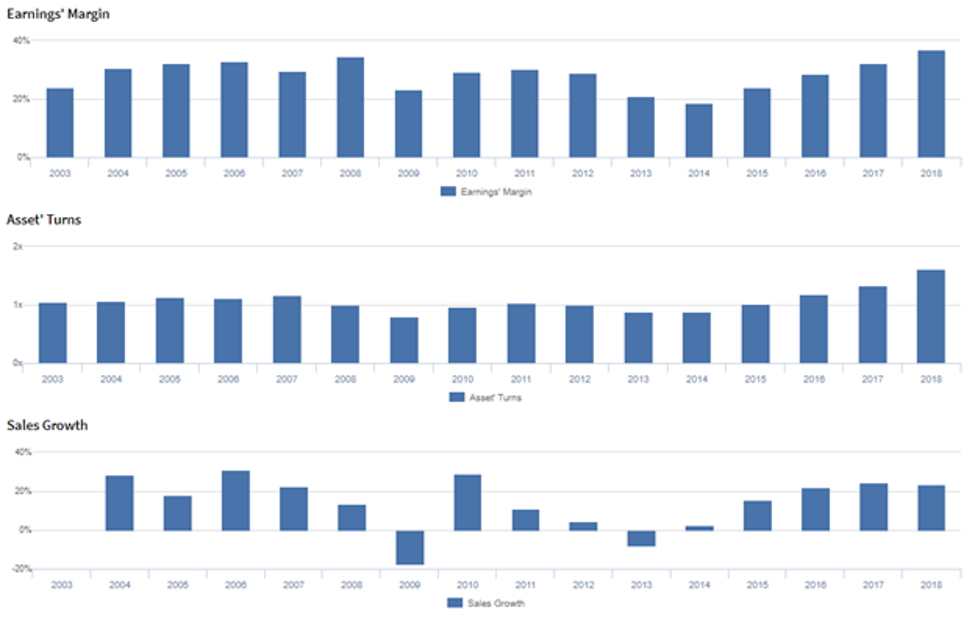
Cyclicality in Uniform ROA has been driven by cyclical trends in Uniform Earnings Margin, and recent expansion has been a result of expanding Uniform Asset Turnover. Uniform Margins reached cycle lows of 24% in 2003, 23% in 2009 and 19% in 2014, while reaching highs of 35% in 2008, 30% in 2011, and 37% in 2018. Meanwhile, Uniform Turns improved from 1.1x to 1.2x from 2003 to 2007, before dropping to trough 0.8x levels in 2009, and stabilizing at 0.9x-1.0x through 2015. Since then, they have jumped to a peak of 1.6x in 2018. At current levels, markets are pricing in expectations for record improvements in both Uniform Margins and Uniform Turns.
Earnings Call Forensics
Valens’ qualitative analysis of the firm’s Q3 2019 earnings call highlights that management is confident their mobile apps continue to drive subscriptions. However, they may lack confidence in their ability to sustain their book of business growth, and they may be concerned about the value their Adobe Experience Platform provides to customers. Furthermore, they may lack confidence in their ability to drive new customers to Adobe Stock and to drive operational improvement through consolidation. Finally, they may be exaggerating the degree of differentiation in the Magento product, and they may lack confidence in their ability to drive Creative Cloud demand through their global initiatives.
UAFRS VS As-Reported

Uniform Accounting metrics also highlight a significantly different fundamental picture for ADBE than as-reported metrics reflect. As-reported metrics can lead investors to view a company to be dramatically stronger or weaker than real operating fundamentals highlight. Understanding where these distortions occur can help explain why market expectations for the company may be divergent.
As-reported metrics significantly understate ADBE’s profitability. For example, as-reported ROA for ADBE was 11% in 2018, substantially lower than Uniform ROA of 60%, making ADBE appear to be a much weaker business than real economic metrics highlight. Moreover, Uniform ROA has been at least 3x higher than as-reported ROA in 12 of the 13 years since 2006, significantly distorting the market’s perception of the firm’s profitability.
SUMMARY and Adobe Tearsheet
As our Uniform Accounting tearsheet for Adobe (ADBE) highlights, Adobe trades at a 39x Uniform P/E, which is well above corporate averages and historical levels for the company.
High P/E levels require high EPS growth to sustain valuations. Recently, Adobe has been able to grow its Uniform EPS by 43%.
While Wall Street stock recommendations and valuations poorly track reality, Wall Street analysts have a strong grasp on near-term financial forecasts like revenue and earnings.
As such, we use Wall Street GAAP earnings estimates as a starting point for our Uniform Earnings forecasts. When we do this, we can see that Adobe is forecast to see Uniform EPS growth of 9% in 2019 followed by 16% growth in 2020.
Based on current stock market valuations, we can use earnings growth valuation metrics to back into the required growth rate to justify Adobe’s $306 stock price. These are often referred to as market embedded expectations. In order to justify current stock prices, the company would need to have Uniform Earnings grow by 15% each year over the next three years.
Wall Street analyst expectations are roughly in line with earnings growth rates that justify current valuations.
While Adobe’s valuations are high, its Uniform P/E is actually below peer averages, and its Uniform EPS growth is above peer averages.
Meanwhile, the company’s earnings power is 10x corporate averages, signaling that there is very low cash flow risk to the company’s operations and credit profile.
To summarize, Adobe is a high-profitability company with significant earnings growth potential but fairly high embedded expectations.
Best regards,
Joel Litman & Rob Spivey
Chief Investment Strategist &
Director of Research
at Valens Research


