
This low-cost retailer turned singles into millions, selling more stuff more often, Uniform metrics say it may be too late for the stock now.

This company has been a prime example of how selling more stuff to more customers can lead to a sustained business transformation.
But it may be running out of runway to drive growth through its strategy.
While as-reported metrics make the company look like it has generated significant returns from its strategy, TRUE Uniform metrics show the company’s margins haven’t been as robust as they appear.
While as-reported return metrics show a company with stable returns, Uniform metrics show the returns from this strategy have been declining.
Also below, Uniform Accounting Embedded Expectations Analysis and the Uniform Accounting Performance and Valuation Tearsheet for the company.
Investor Essentials Daily:
Thursday Tearsheets
Powered by Valens Research
The fastest path for a company to constantly create more value for shareholders, resulting in earnings and stock price increases, is just to do three simple things:
- Sell more stuff to its customers
- Sell to more customers
- Be able to constantly raise the price of its offerings
It’s pretty straightforward.
If a company can do all three of those things, it is pretty much guaranteed to be able to consistently deliver growth for investors, and to beat and raise.
Apple (AAPL) is a prime example of a company that has been able to achieve this.
They can sell more stuff to their customers, expanding from iPhones to iPads, Apple Watches, and AirPods.
They sell to more customers by offering a wider range of pricing options – from the iPhone 11 Pro Max starting at $1,099 to an iPhone 8 at $449 in the US, and constantly expanding internationally.
With the iPhone X, they broke $1,000 for buying a phone. That’s more than what many people reading this note probably paid for their first car.
That is how Apple has become one of only three $1 trillion market cap companies.
A surefire way to find a company that has achieved all three of the goals above is to find a company that has massive Uniform asset growth, with consistently high Uniform ROA.
You won’t find this using as-reported metrics.
After all, Apple only has an 11% as-reported ROA. But when you look at the REAL numbers, this becomes apparent.
If a company can’t do all three things but can do two of them well, that can be a recipe for strong, if not sustainable returns. It can also be a recipe for robust shorter-term growth.
Dollar General (DG) is a great example of a company that has done two of those things excellently over the past 10-plus years: sell more stuff and sell to more customers.
Just by its name alone, Dollar General can’t really regularly raise the price of their offerings.
But in terms of selling more stuff to customers, and getting more customers, it and the rest of the dollar stores have done an impressive job.
Starting in the late 2000s, as the US was emerging from the Great Recession, Dollar General, Dollar Tree (DLTR), and Family Dollar, now owned by Dollar Tree, started aggressively pursuing growth strategies.
All the companies recognized that with the more challenging economic environment, customers facing a tight budget would be looking for ways to save cash short-term. They’d be looking at bargain shops.
To attract more customers to buy their offerings, the dollar stores started to expand their footprint.
At the same time, they started to focus on adding new offerings in their stores. They moved from small-sized non-disposable options to offering liquids and meals in fridges and seasonal offerings, to name a few.
They understood that if they could offer a wider range of products, their customers would spend more with them, and start coming back more often. Customers would start viewing the dollar stores as their main destination for their daily needs, not a supplemental journey.
They were getting their customers to spend more money at their stores, more often.
This strategy led average Uniform ROA to rise from 10% before 2007 to 13%-20% since 2010. Structurally, the strategy of selling more, more often, to more customers worked in producing a higher return business.
The market trusts that Dollar General and the company’s peers can continue to deliver on this strategy. At current valuations, Dollar General is priced for returns to remain around 15% levels going forward, where returns have been the last 5 years.
However, Dollar General may be reaching a point where it can’t keep on driving growth in the same way.
Management is growing less confident about growing through their grocery DG Fresh initiative. They’re losing confidence about sustaining market share growth, and management isn’t confident about the returns they’re seeing from their marketing.
That points to a business that may finally be running out of the ability to sell more to their customers, and sell to more customers. The company may have maximized its share of customer wallets.
Dollar General Embedded Expectations Analysis – Market expectations are for Uniform ROA expansion, but management may be concerned about their market share, DG Fresh, and marketing
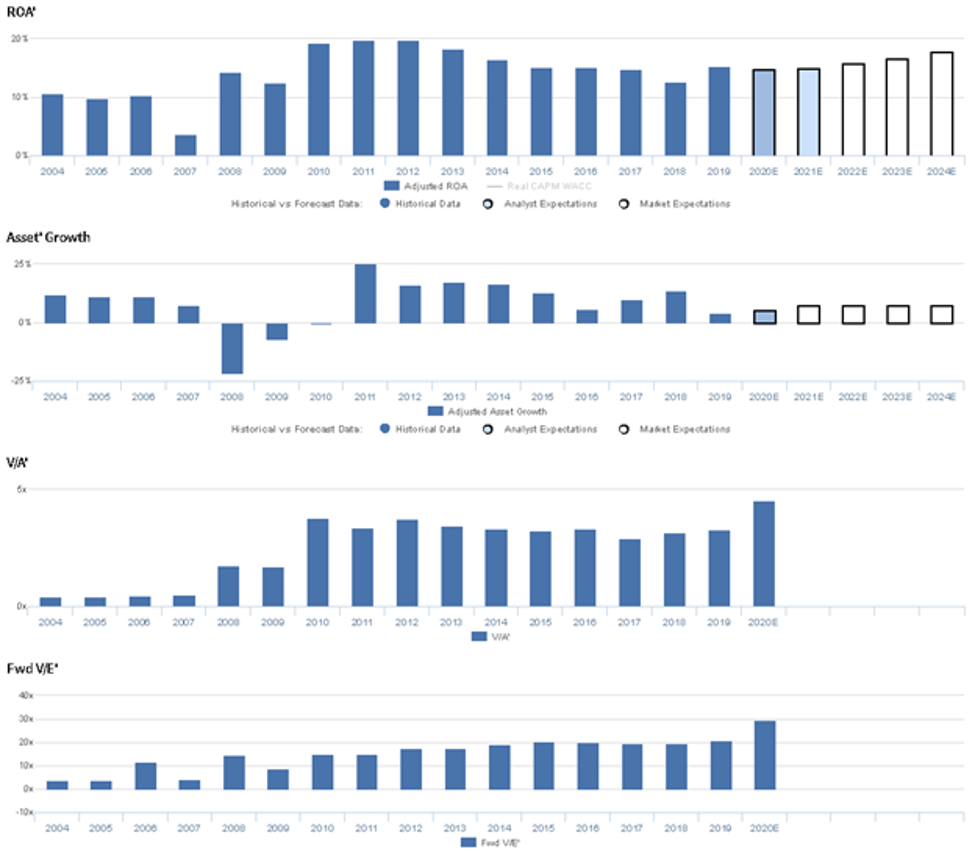
DG currently trades above recent averages relative to UAFRS-based (Uniform) Earnings, with a 23.8x Uniform P/E. At these levels, the market is pricing in expectations for Uniform ROA to remain at 15% through 2024, accompanied by 7% Uniform Asset growth going forward.
Furthermore, analysts have similar expectations, projecting Uniform ROA to sustain 15% levels through 2021, accompanied by 6% Uniform Asset growth.
Historically, DG has seen cyclical profitability. Uniform ROA sustained 10%-11% levels in 2004 through 2006, before falling to 4% in 2007. However, as the economy recovered, Uniform ROA also recovered, expanding to a peak of 20% levels in 2011-2012, before slowly fading to 15% levels in 2019.
Meanwhile, Uniform Asset growth has been positive in 13 out of the past 16 years, ranging from -22% to 25% levels.
Performance Drivers – Sales, Margins, and Turns
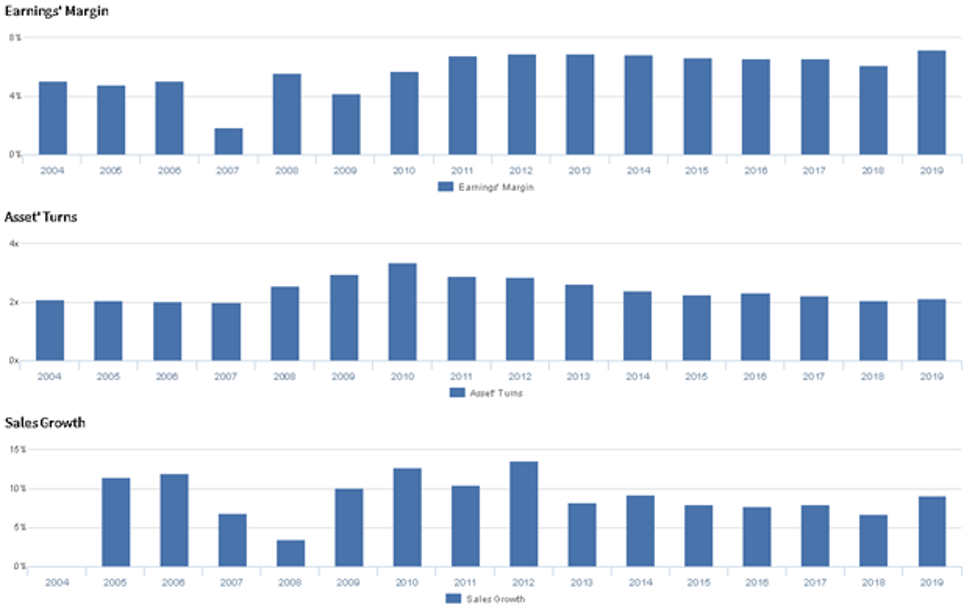
Trends in Uniform ROA have been driven by trends in both Uniform Earnings Margin and Uniform Asset Turns. Uniform Margins have been cyclical in nature, falling from 5% in 2004 to 2% in 2007, before improving to 7% levels from 2011 to 2019, excluding 6% underperformance in 2018.
Meanwhile, from 2004 to 2010, Uniform Turns steadily improved from 2.1x to 3.4x, before declining back to 2.1x in 2019. At current valuations, markets are pricing in expectations for stable Uniform Margins and improving Uniform Turns.
Earnings Call Forensics
Valens’ qualitative analysis of the firm’s Q2 2019 earnings call highlights that management is confident their $19 million in SG&A expense is invested in their strategic initiatives.
However, they may lack confidence in their ability to sustain recent market share improvements, and they may be concerned about the strength of their DG Fresh initiative.
Furthermore, they may lack confidence in their ability to drive category awareness to their customers, and they may be concerned about the robustness of their real estate model.
Finally, they may lack confidence in their ability to sustain recent improvements to employee engagement, and they may be exaggerating their competitive moat in their market.
UAFRS VS As-Reported
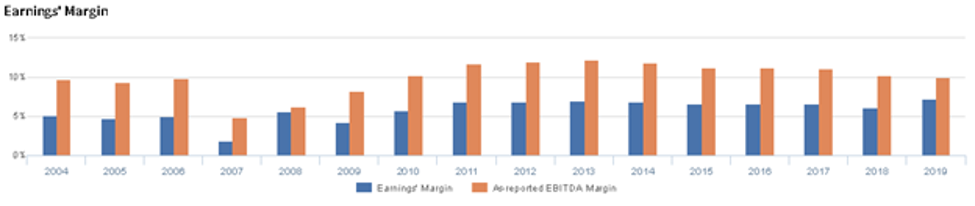
Uniform Accounting metrics also highlight a significantly different fundamental picture for DG than as-reported metrics reflect. As-reported metrics can lead investors to view a company to be dramatically stronger or weaker than real operating fundamentals highlight. Understanding where these distortions occur can help explain why market expectations for the company may be divergent.
As-reported metrics significantly overstate DG’s margins, one of the primary drivers of profitability. For example, as-reported EBITDA margin for DG was near 10% in 2019, higher than Uniform Earnings Margin of 7% in the same year, making DG appear to be a much stronger business than real economic metrics highlight.
Moreover, as-reported margins have been consistently greater than Uniform Margins in each year since 2004, significantly distorting the market’s perception of the firm’s performance for well over a decade.
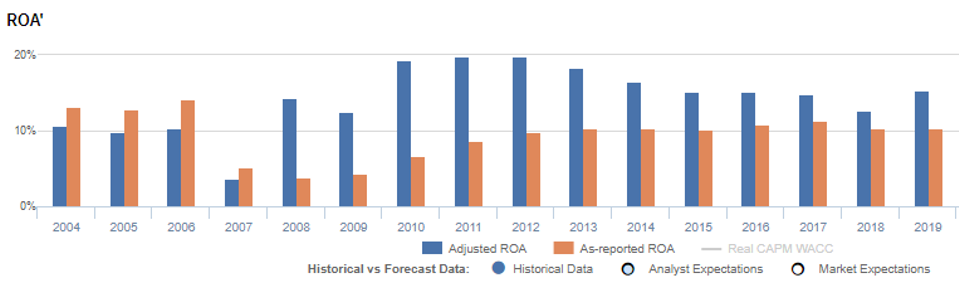
Also, Uniform Accounting metrics highlight that as-reported ROA has misrepresented the trend of DG’s returns the past 8+ years.
As-reported ROA has been trending up-to-flat since 2010. It rose from 7% in 2010 to 10% in 2013, before plateauing at those levels since.
In reality, Uniform ROA shows the company’s profitability has actually rolled over since 2010. In 2010-2012, Uniform ROA peaked around 20%, and it has since fallen to around 15%.
DG is not a company with improving profitability from its strategy. The strategy yielded significant ROA expansion from 2009-2011. Since then the company has grown, but its investments have led to declining returns.
Dollar General Tearsheet
Apologies if you have been trying to access the Tearsheet of the Day the last two weeks. We’ve corrected the issue where the tearsheet wasn’t viewable. Going forward, the tearsheet of the day will be available to all viewers, on the Valens Research public site.
As our Uniform Accounting tearsheet for Dollar General highlights, Dollar General trades above corporate average valuations. The company has recently had 33% Uniform EPS growth. EPS growth is forecast to be 10%, in 2020, and 9% levels in 2021.
At current valuations, the market is pricing the company to see earnings increase by 5% a year going forward.
The company’s earnings growth is around peer averages in 2020, but the company is trading at a slight premium over average peer valuations. The company has strong returns, and no cash flow risk to their dividend going forward.
Best regards,
Joel Litman & Rob Spivey
Chief Investment Strategist &
Director of Research
at Valens Research


