
UAFRS shows this company’s investment in “surge capacity” hasn’t just saved lives in the pandemic, its led to high profitability

The coronavirus pandemic highlighted the struggle of healthcare workers and the shortage of PPE (Personal Protective Equipment). With the number of cases rapidly rising, one company has sought to ramp up the supply and keep them protected.
As-reported metrics indicate that the company’s excess investment previously, which makes this surge possible, has pressured returns. However, Uniform Accounting shows that the company’s investment in these capabilities is why its profitability is robust.
Also below, Uniform Accounting Embedded Expectations Analysis and the Uniform Accounting Performance and Valuation Tearsheet for the company.
Investor Essentials Daily:
Thursday Tearsheets
Powered by Valens Research
For the past 4 months, the coronavirus pandemic has put the world on lockdown, with over 4 million cases worldwide.
One of the biggest storylines that emerged during this pandemic was the shortage of Personal Protective Equipment (PPE) for healthcare workers. This includes gloves, medical gowns, and masks. One type of mask in particular, the N95, has been on high demand in medical facilities across the world.
This shortage has put medical professionals at risk of getting infected, which is why companies like 3M (MMM) have set themselves up to ramp-up the manufacturing of protective equipment.
Safety is the calling card of the company, providing different kinds of protective and safety equipment for multiple industries.
This includes insulation, protective gear, paint protection, fire protection, adhesives, and laminates.
It has also expanded its product range to include stationery, home improvement, and office supplies.
3M’s ability to create products that people need, innovate them and manage for those needs, has been crucial in cementing it as one of the top providers of safety equipment.
Being a top name in safety equipment means the company needs to be able to supply PPE when demand surges. But epidemics such as H1N1 and Ebola showed 3M wasn’t prepared to do so.
So 3M built up what it called “surge” capacity to handle any future pandemic that would need rapid growth in PPE like masks.
This prepared it for the coronavirus pandemic, as it was able to ramp up spare capacity aggressively to increase production of face masks and other protective equipment. It is looking to manufacture 1 billion masks by the end of 2020, ensuring that healthcare workers have enough supplies during the course of the pandemic.
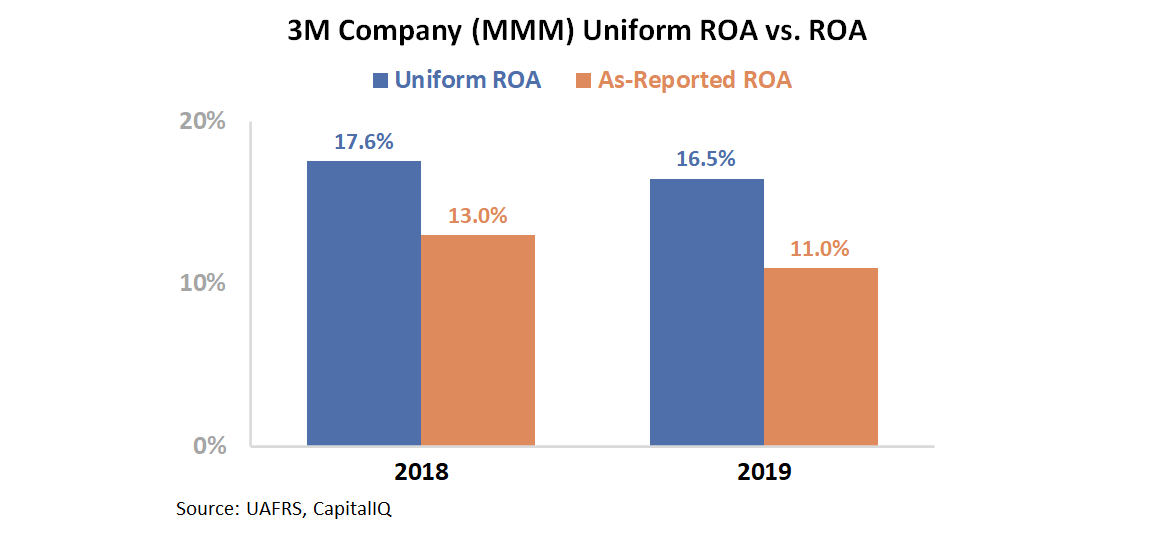
3M’s commitment to product innovation and providing supplies during emergencies like today’s pandemic are noble, but having that much capacity that is sitting dormant may be pulling down the company’s return on assets (ROA). Its ROA declined in 2019 from 13% to 11%, and remains somewhat subdued.

In reality though, even with its investment in this surplus capacity its 2018 and 2019 ROA remained robust.
Being one of the top suppliers of needed equipment across the world has allowed 3M to deliver needs to its customers across different industries.
Its high value products, which are needed around the world, and focus on meeting customers needs, even when they are extraordinary, has helped it sustain strong returns that are likely to continue moving forward.
Even after the pandemic recedes, demand for 3Ms products will continue to remain, and the reputation it has built for itself will continue to allow it to charge for the value it creates, sustaining high ROAs.
Market expectations are for slight Uniform ROA compression, and management may be concerned about PFAs, their strategy, and growth
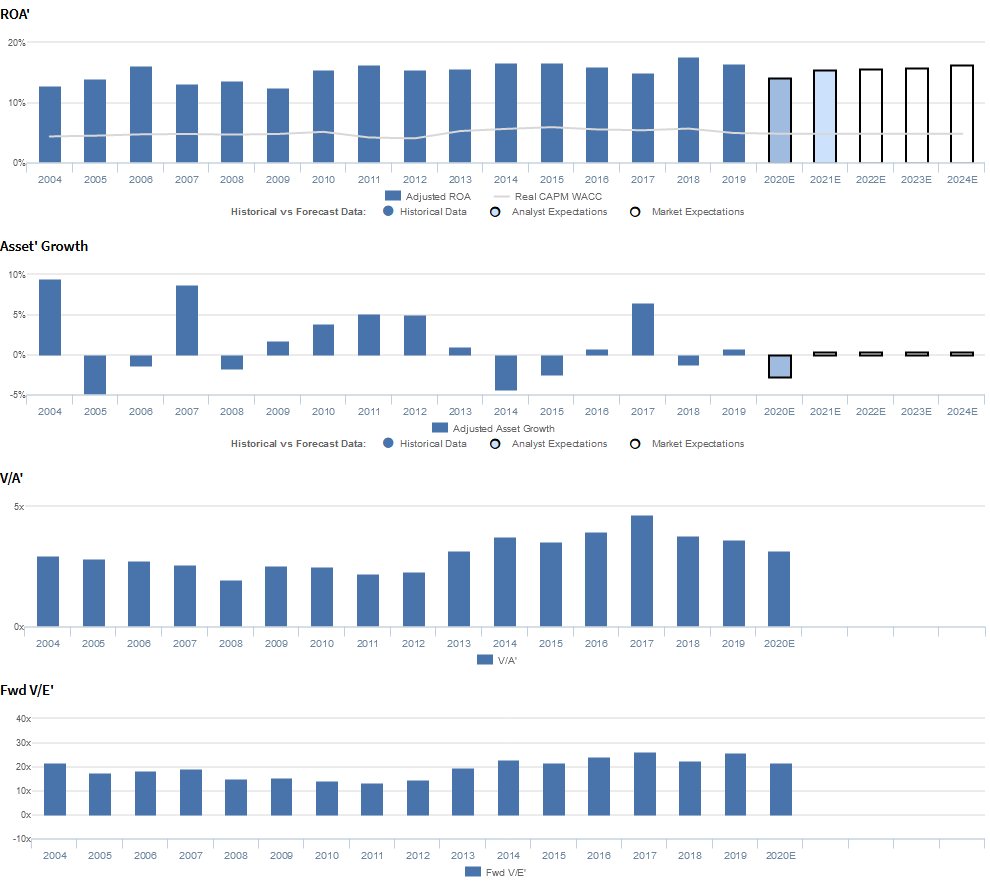
MMM currently trades below recent averages relative to Uniform earnings, with an 20.7x Uniform P/E (Fwd V/E′).
At these levels, the market is pricing in expectations for Uniform ROA to marginally decline from 17% in 2019 to 16% in 2024, accompanied by immaterial Uniform asset growth going forward.
Meanwhile, analysts have similar expectations, projecting Uniform ROA to decline to 16% levels through 2021, accompanied by 3% Uniform asset shrinkage.
MMM has seen somewhat cyclical, yet generally improving profitability. After expanding from 13% in 2004 to 16% in 2006, Uniform ROA faded to 13% in 2009, before rebounding to 16%-17% levels through 2016. Then, after compressing to 15% in 2017, Uniform ROA improved to 17%-18% levels in 2018-2019.
Meanwhile, Uniform asset growth has been volatile, yet muted, positive in ten of the past sixteen years, while ranging from -5% to 10%.
Performance Drivers – Sales, Margins, and Turns
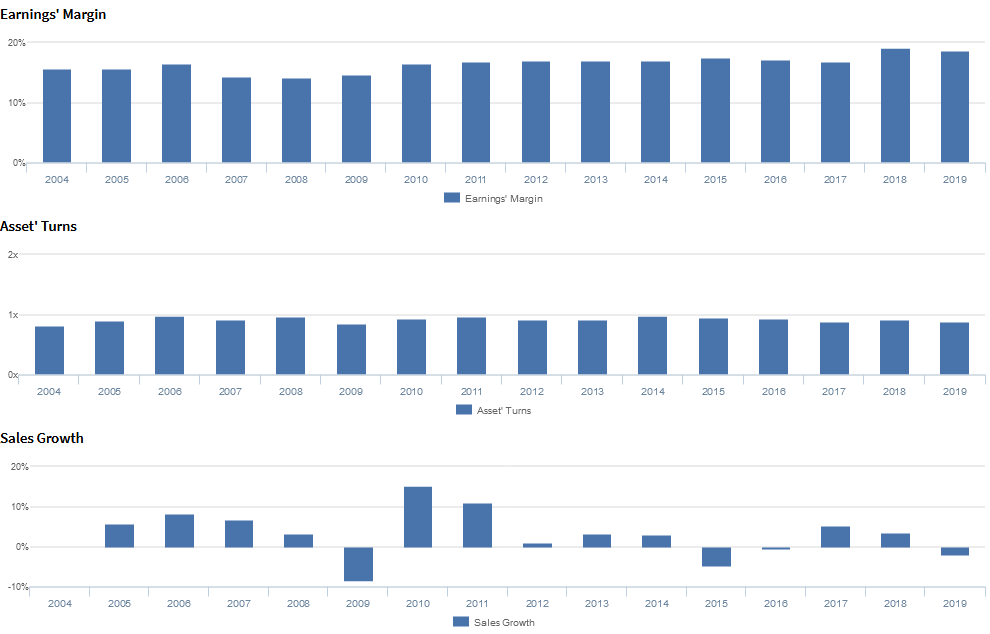
Trends in Uniform ROA have been largely driven by trends in Uniform earnings margins, coupled with stability in Uniform asset turns.
Uniform margins expanded from 16% in 2004 to 17% in 2006, before fading to 14% in 2008. Thereafter, Uniform margins improved to 17% levels from 2010 through 2017 and expanded further to 19% peaks in 2018-2019.
Meanwhile, Uniform turns have been stable, ranging at 0.9x-1.0x levels since 2005.
At current valuations, markets are pricing in expectations for a slight Uniform margins regression, coupled with further stability in Uniform turns.
Earnings Call Forensics
Valens’ qualitative analysis of the firm’s Q4 2019 earnings call highlights that management is confident their transformation journey is as much a cultural change as it is technology change.
However, they may lack confidence in their ability to address PFA disposal issues and be proactive in the management of PFAs.
Moreover, they may be concerned about their newly adopted go-to-market model approach, and they may be exaggerating the strength of their macro outlook and the progress they made on their strategic priorities in 2019.
Furthermore, management may lack confidence in their ability to sustain organic growth, improve margins, and drive price growth through innovation.
Finally, they may be overstating the breadth of their expertise and their ability to sustain platform growth.
UAFRS VS As-Reported
Uniform Accounting metrics also highlight a significantly different fundamental picture for MMM than as-reported metrics reflect.
As-reported metrics can lead investors to view a company to be dramatically stronger or weaker than real operating fundamentals highlight.
Understanding where these distortions occur can help explain why market expectations for the company may be divergent.
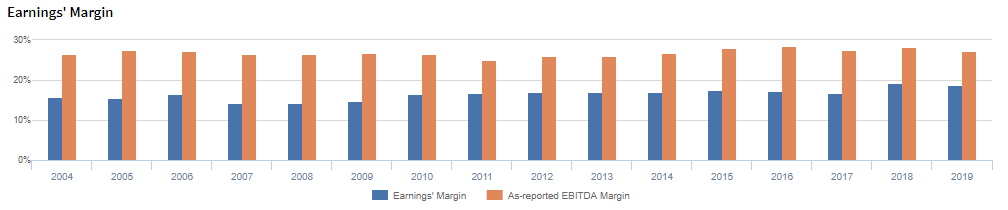
As-reported metrics significantly overstate MMM’s margins, one of the primary drivers of profitability.
For example, as-reported EBITDA margin for MMM was 27% in 2019, substantially higher than Uniform Earnings Margin of 19% in the same year, making MMM appear to be a much stronger business than real economic metrics highlight.
Moreover, as-reported margins have remained at 27%-29% levels from 2016-2018, while Uniform Margins have expanded from 17% to 19% over the same period, distorting the market’s perception of the firm’s recent profitability trends.
SUMMARY and 3M Company Tearsheet
As the Uniform Accounting tearsheet for 3M Company (MMM) highlights, the Uniform P/E trades at 20.7x, which is around corporate average valuation levels, but below its own recent history.
High P/Es require high EPS growth to sustain them. In the case of 3M, the company has recently shown a 4% Uniform EPS shrinkage.
Wall Street analysts provide stock and valuation recommendations that in general provide very poor guidance or insight. However, Wall Street analysts’ near-term earnings forecasts tend to have relevant information.
We take Wall Street forecasts for GAAP earnings and convert them to Uniform earnings forecasts. When we do this, 3M’s Wall Street analyst-driven forecast is a 16% shrinkage in 2020, and a 12% growth in 2021.
Based on current stock market valuations, we can use earnings growth valuation metrics to back into the required growth rate to justify 3M’s $139 stock price. These are often referred to as market embedded expectations.
In order to justify current stock prices, the company would need to have Uniform earnings shrink by 2% each year over the next three years. What Wall Street analysts expect for 3M’s earnings growth is below what the current stock market valuation requires in 2020 but is above that requirement in 2021.
The company’s earning power is 3x the corporate average. Also, cash flows are higher than its total obligations—including debt maturities, capex maintenance, and dividends. Together, this signals low credit and dividend risk.
To conclude, 3M’s Uniform earnings growth is below peer averages in 2020. Also, the company is trading above average peer valuations.
Best regards,
Joel Litman
Chief Investment Strategist
at Valens Research


