
Uniform Accounting shows this company is still profiting from the most profitable commodity of the Middle Ages

Spices have been one of the most valuable commodities for a number of centuries, especially during the Age of Exploration. While as-reported metrics state that spices are not as valuable as they were before, this American food company has proven controlling the industry still holds great value.
Also below, Uniform Accounting Embedded Expectations Analysis and the Uniform Accounting Performance and Valuation Tearsheet for the company.
Investor Essentials Daily:
Thursday Tearsheets
Powered by Valens Research
Throughout the Middle Ages and the Renaissance, spices were one of the most valuable commodities.
At that time, it bought tremendous amounts of wealth for traders across Europe, and became one of the major factors that led to the Age of Exploration during the 15th to 17th century.
Spain and Portugal led much of the early expeditions, with Spain discovering the Americas and crossing the Pacific, while the Portuguese, sailed around the Cape of Good Hope.
These expeditions helped spread the influence of both kingdoms and gain direct access to the spice trade, disintermediating Italian and Middle Eastern traders selling them at very high prices.
Nowadays, it can be hard to imagine a kitchen condiment as one of the world’s most valuable commodities, but food companies like McCormick (MKC) remain a leader in the world of spices.
For over 131 years, the company has thrived in selling spices to consumers across the globe, offering dozens of seasoning and condiment products.
These products have become household staples, with kitchens constantly stocked with their spices and seasoning.
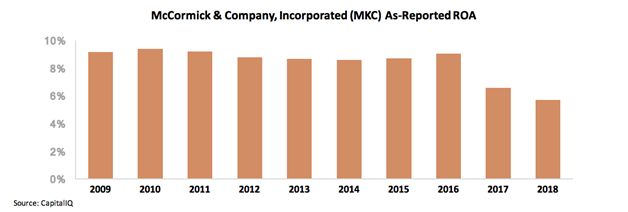
McCormick remains one of the leaders in the modern spice industry. However, as-reported metrics show that this trade is no longer as valuable as it was back then. Return on assets (ROA) reached 9% in 2016, but has been dropping in the next few years.
While spice became the catalyst for some of history’s biggest events centuries ago, their value is no longer the same, and it shows.
But in reality, McCormick’s control of the spice trade has helped it generate great returns. The company’s Uniform ROA has increased since 2015—it shows that spice is still a valuable commodity that sells well.
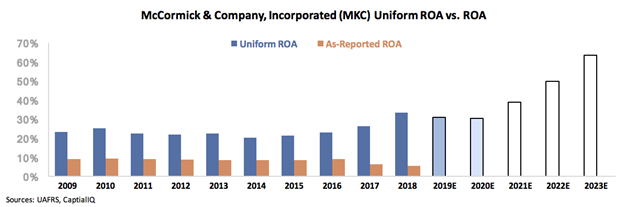
Its branding has contributed to turning its products into household names. The increasing returns also indicate that spices are just as valuable as they were during the era of the Dutch East Indies.
Commodities can drop in value after a long period of time, especially in a span of centuries. McCormick was able to thrive in the market by becoming an industry leader with a recognizable brand.
McCormick & Company, Incorporated – Market expectations are for Uniform ROA expansion, and management is confident about growth, profitability, and their outlook
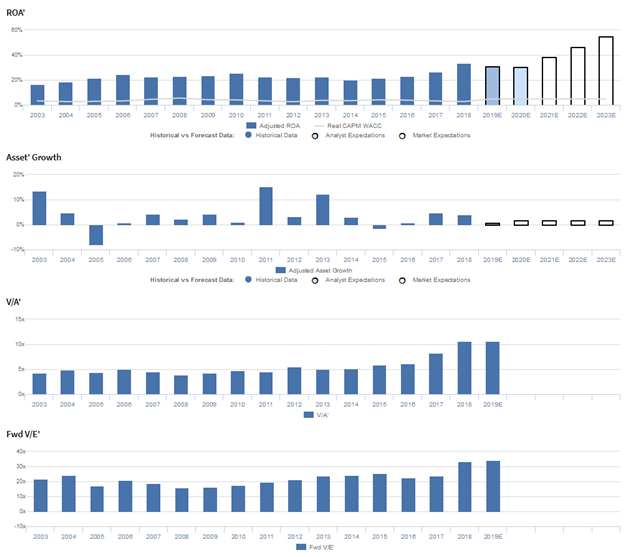
MKC currently trades at historical highs relative to Uniform earnings, with a 36.2x Uniform P/E (Fwd V/E’).
At these levels, the market is pricing in expectations for Uniform ROA to rise from 34% in 2018 to a peak of 55% in 2023, accompanied by 2% Uniform asset growth forward.
However, analysts have bearish expectations, projecting Uniform ROA to regress to 31% by 2020, accompanied by 1% Uniform asset growth.
Historically, MKC has seen robust, generally improving profitability. Uniform ROA expanded from 16% in 2003 to 23%-25% levels from 2006-2011, before fading to 20% in 2014, and climbing to a peak of 34% in 2018.
Meanwhile, Uniform asset growth has been consistent, positive in fourteen of the past sixteen years, while ranging from -8% to 15%.
Performance Drivers – Sales, Margins, and Turns

Trends in Uniform ROA have been driven largely by trends in Uniform earnings margins, and to a lesser extent, Uniform asset turns.
Uniform margins expanded from 9% in 2003 to 10%-11% levels in 2005-2012, before improving further to a peak of 15% in 2018.
Meanwhile, Uniform turns climbed from 1.9x in 2003 to 2.3x in 2008, before compressing to 1.9x levels in 2013-2015, and rebounding to peak 2.3x levels in 2018.
At current valuations, markets are pricing in expectations for both Uniform margins and Uniform turns to expand to new peaks.
Earnings Call Forensics
Valens’ qualitative analysis of the firm’s Q3 2019 earnings call highlights that management is confident their constant currency sales grew 4%, they delivered significant operating margin expansion, and that they made significant progress over the past four years to improve their operating profit.
Moreover, they are confident they are well-positioned to deliver another strong year of performance in 2019 and that they are again increasing their 2019 adjusted EPS guidance.
Furthermore, they are confident they anticipate one-off factors that negatively impacted their performance will not impact them significantly going forward.
However, management may lack confidence in their ability to sustain growth in their quick service restaurant and flavor solutions business sales, organic revenues, and portfolio diversity.
In addition, they may be concerned about the impact of customer promotional activities and their exposure to consumer and US businesses.
Finally, they may lack confidence in their ability to manage marketing costs and may be downplaying concerns about logistics headwinds.
UAFRS VS As-Reported
Uniform Accounting metrics also highlight a significantly different fundamental picture for MKC than as-reported metrics reflect.
As-reported metrics can lead investors to view a company to be dramatically stronger or weaker than real operating fundamentals highlight.
Understanding where these distortions occur can help explain why market expectations for the company may be divergent.
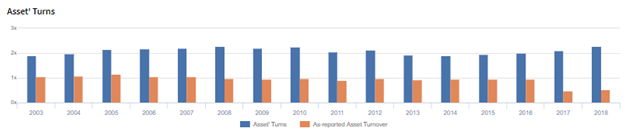
As-reported metrics significantly understate MKC’s asset turnover, one of the primary drivers of profitability.
For example, as-reported asset turnover was 0.5x in 2018, materially smaller than Uniform asset turns of 2.3x in the same year, making MKC appear to be a far less efficient business than real economic metrics highlight.
Moreover, as-reported asset turnover has been about half of Uniform turns or less in each year since 2004, distorting the market’s perception of the firm’s historical asset efficiency trends.
SUMMARY and McCormick & Company, Incorporated Tearsheet
As the Uniform Accounting tearsheet for McCormick & Company, Incorporated (MKC) highlights, Uniform P/E trades at 36.2x, which is above global average valuations and historical average valuations for the company.
High P/Es require high EPS growth to sustain them. In the case of McCormick, the company has recently shown a 17% Uniform EPS growth.
Wall Street analysts provide stock and valuation recommendations that in general provide very poor guidance or insight. However, Wall Street analysts’ near-term earnings forecasts tend to have relevant information.
We take Wall Street forecasts for GAAP earnings and convert them to Uniform earnings forecasts. When we do this, McCormick’s Wall Street analyst-driven forecast is Uniform EPS shrinkage of 7% in 2019, and a 2% growth in 2020.
Based on current stock market valuations, we can back into the required earnings growth rate that would justify $164 per share. These are often referred to as market embedded expectations.
In order to meet current market valuation levels, McCormick would have to have Uniform earnings to grow by 11% each year over the next three years.
What Wall Street analysts expect for McCormick & Company’s earnings growth is below what the current stock market valuation requires.
Meanwhile, the company’s earnings power is 6x corporate averages. However, cash flows and cash on hand fall below their total obligations, signaling that there is a high risk to the company’s dividends and overall credit profile.
To conclude, McCormick & Company’s Uniform earnings growth is in line with peer averages, and the company’s price to earnings is above peer average valuations.
Best regards,
Joel Litman & Rob Spivey
Chief Investment Strategist &
Director of Research
at Valens Research


