
Uniform Accounting shows this vertically integrated software powerhouse has learned lessons from the 19th century that yield strong returns

Horizontally integrated and vertically integrated monopolies have been around for a long period of time. Classic examples of both dominated the late 19th century in their respective industries. It is no surprise that there are still companies looking to follow their example.
This company is a recent example of vertical integration, making billion-dollar acquisitions in order to expand its product offerings and develop new technologies.
While as-reported metrics imply these acquisitions have not translated into solid returns, Uniform Accounting shows the reality: a company that continues to grow and innovate.
Also below, Uniform Accounting Embedded Expectations Analysis and the Uniform Accounting Performance and Valuation Tearsheet for the company.
Investor Essentials Daily:
Tuesday Tearsheets
Powered by Valens Research
There are two different types of monopolies, horizontally integrated and vertically integrated.
Horizontally integrated monopolies happen when a company looks to expand by acquiring a similar company within their own industry. Standard Oil was a classic example of a horizontal monopoly early in its development, as Rockefeller sought to roll-up all oil refineries in America.
On the other hand, vertically integrated monopolies acquire companies in order to control and strengthen their supply chain and their end markets. A classic example of this would be Carnegie Steel, buying iron ore, transportation, coking coal supplies, along with growing steel plants to drive down production costs.
After the Trust Busting era during the early 1900s, vertical monopolies went out of style. Many thought for a while that they were a thing of the past. But in reality, they have never fully gone away. They’ve just popped up in new industries with different looks.
Oracle (ORCL) is a great example of a modern vertically integrated monopoly.
The technology company provides a multitude of software and technology products to its corporate customers. This includes databases, enterprise software, cloud computing, ERPS, and servers.
But Oracle didn’t start that way. The firm started in 1977 just providing one thing, databases. That was pretty much all Oracle did for much of its first 20-30 years, and it did it phenomenally.
It was an industry leader in the space, until the point where there were really only three companies out there that provided databases.
Oracle, Microsoft, and IBM were the leading database companies, and for many, it was really just a choice between Oracle and Microsoft’s SQL databases.
But Oracle was the only pureplay company in the space, its competitors offered other products they could bundle with databases. They didn’t have to solely focus on the profitability of the databases.
Oracle started to grow concern about margin compression, and asked itself how it could protect its core business…and Carnegie Steel’s lessons came back to Larry Ellison and his team.
Instead of just being a database firm, Oracle looked up and down the value chain from databases, to fill in its offerings.
It would become stickier with their customers, as corporations relied on Oracle for more products. Also, by bundling products it could optimize pricing for each customer, protecting its margins.
To fill in its offerings, Oracle went on a spending spree.
This includes billion-dollar acquisitions such as Netsuite ($7 billion) and Peoplesoft ($10.3 billion), two ERP systems that sit on top of a database. It acquired BEA Systems ($8.4 billion), Siebel Systems ($5.6 billion), and Hyperion Solutions ($3.3 billion), which designs other software platforms on top of databases. It even bought Sun Microsystems ($8.3 billion), a maker of servers that databases sat on top of.
Oracle’s goal was to gather its value chain and end market together, to better control the value creation.
But investors might be scratching their heads about why this hasn’t translated into stronger return for the business, as expected.
As-reported return on assets (ROA) has been in a decline since 2014, and has been modest overall since 2006. It appears like Oracle’s acquisitions and wide product portfolio have been struggling to generate great returns, only reaching the 6%-7% range in 2016-2019.
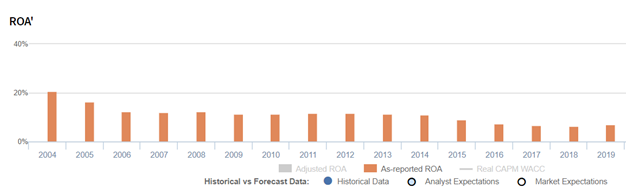
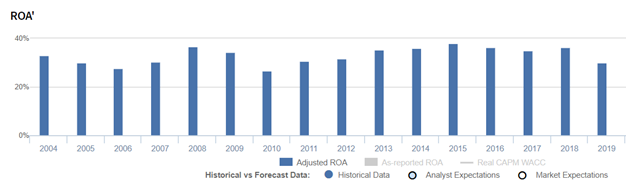
But in reality, Oracle has been generating strong returns, performing significantly better than what as-reported metrics reflect.
Oracle’s true, Uniform Accounting ROA reaching over 30% since 2011. Oracle’s returns have been stronger than as-reported metrics reflect, and this is due in part to the power of vertical integration.
Its aggressive marketing and acquisitions have helped the company remain a leader in database technology, allowing it to expand its product range, and develop new technologies that will help it grow in the future.
The company’s cross-selling was also very effective in ensuring that clients place a focus on investing in their technology, and would be less likely to change from Oracle because the bundle was so easy.
In the near term, management may be concerned with the current pandemic affecting their operations and supply chain like many companies are, but a strong product offering should help them defend their returns in the long run.
Oracle Corporation Embedded Expectations Analysis – Market expectations are for Uniform ROA to decline to new lows, and management may be concerned about business wins, COVID-19, and their Autonomous Database
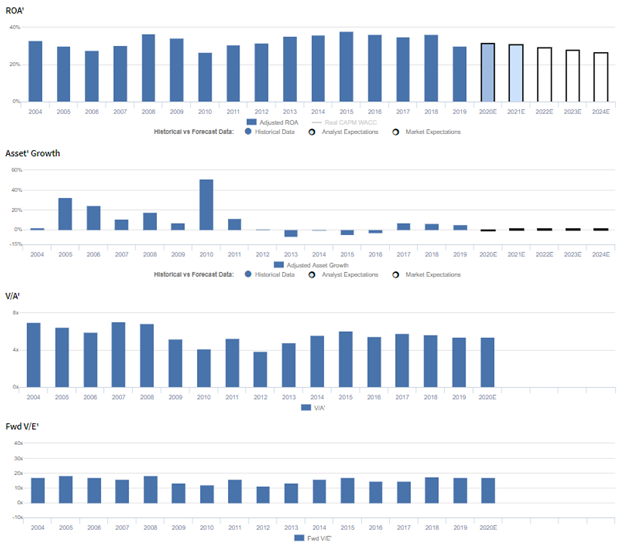
ORCL currently trades below corporate averages relative to Uniform earnings, with a 16.5x Uniform P/E (Fwd V/E’).
At these levels, the market is pricing in expectations for Uniform ROA to fade from 30% in 2019 to 26% in 2024, accompanied by 1% Uniform asset growth going forward.
However, analysts have more bullish expectations, projecting Uniform ROA to improve to 31% levels in 2021, accompanied by 1% Uniform asset shrinkage.
Historically, ORCL has seen robust profitability, as the company has benefitted from high switching costs and substantial renewal rates on their offerings, leading to material recurring revenue streams and limited customer acquisition costs.
After ranging from 28%-33% from 2004-2007, Uniform ROA improved to 37% in 2008 before falling to 27% in 2010.Thereafter, Uniform ROA improved to 38% by 2015 before fading back to 30% levels in 2019.
Meanwhile, following muted 2% growth in 2004, Uniform asset growth was robust from 2005-2011, ranging from 7%-51%, as the firm rolled up competitors such as Sun Microsystems and BEA Systems.
However, since then, Uniform asset growth has been muted once again, positive in just four of the past eight years, while ranging from -7% to 7%.
Performance Drivers – Sales, Margins, and Turns

Trends in Uniform ROA have been driven by offsetting trends in Uniform earnings margins and Uniform asset turns.
After improving from 25% in 2005 to 31% in 2009, Uniform margins fell to 24% in 2010 before rebounding to 33%-34% levels from 2013-2017. Thereafter, Uniform earnings margins expanded to 37% in 2018 and subsequently faded to 32% in 2019.
Meanwhile, after maintaining 1.1x-1.3x levels in 2004-2008, Uniform turns compressed to 1.0x-1.1x levels through 2018 before fading to 0.9x in 2019.
At current valuations, the market is pricing in expectations for both Uniform earnings margins and Uniform asset turns to continue recent declines.
Earnings Call Forensics
Valens’ qualitative analysis of the firm’s Q3 2020 earnings call highlights that management may be exaggerating their ability to sustain ERP and EPM business wins in cloud and the quality of the technology that their applications are built on.
In addition, they may be concerned about the impact of COVID-19-related supply shortages on their supply chain, and they may lack confidence in their Autonomous Database’s ability to continue to drive average consumption rate increases.
UAFRS VS As-Reported

Uniform Accounting metrics also highlight a significantly different fundamental picture for ORCL than as-reported metrics reflect.
As-reported metrics can lead investors to view a company to be dramatically stronger or weaker than real operating fundamentals highlight. Understanding where these distortions occur can help explain why market expectations for the company may be divergent.
As-reported metrics significantly understate ORCL’s profitability.
For example, as-reported ROA for ORCL was near 7% levels in 2019, materially lower than Uniform ROA of 30%, making ORCL appear to be a much weaker business than real economic metrics highlight.
Moreover, as-reported ROA has declined from 11% in 2010 to 7% in 2019, while Uniform ROA has improved from 27% to 30% during this time, directionally distorting the market’s perception of the firm’s historical profitability trends.
SUMMARY and Oracle Corporation Tearsheet
As the Uniform Accounting tearsheet for Oracle Corporation (ORCL) highlights, Uniform P/E trades at 16.5x, which is below corporate average valuations but aroundd historical average valuations for the company.
Low P/Es require low EPS growth to sustain them. In the case of Oracle, the company has recently shown a Uniform EPS decline of 2%.
Wall Street analysts provide stock and valuation recommendations that in general provide very poor guidance or insight. However, Wall Street analysts’ near-term earnings forecasts tend to have relevant information.
We take Wall Street forecasts for GAAP earnings and convert them to Uniform earnings forecasts. When we do this, Oracle’s Wall Street analyst-driven forecast is for Uniform EPS growth of 22% in 2020 and 1% in 2021.
Based on current stock market valuations, we can back into the required earnings growth rate that would justify $53 per share. These are often referred to as market embedded expectations. In order to meet current market valuation levels, Oracle would have to have Uniform earnings shrinkage of 3% each year over the next three years.
What Wall Street analysts expect for Oracle’s earnings growth is above what the current stock market valuation requires.
Meanwhile, the company’s earnings power is 5x corporate averages. Furthermore, their cash flows and cash on hand are 3x their total obligations—this includes debt maturities, maintenance capex, and dividends—which signals that there is a low risk to the company’s operations and credit profile.
To conclude, Oracle’s Uniform earnings growth is above peer averages but price to earnings is below peer average valuations.
Best regards,
Joel Litman & Rob Spivey
Chief Investment Strategist &
Director of Research
at Valens Research


