
Your Capital Structure is as Important as Your Business Model

Many airline analysts talk about Southwest (LUV) as a mythical operating company. A company that can buck the economic trends that historically brought down other airlines regularly for the past 50+ years.
Because of Southwest’s low cost model, they must be economically immune. Or maybe it is their culture. Perhaps their lack of focus on business customers, and instead their focus on the individual flier, has some secret value with the business. Even though it means they lose out on premium ticket sales, the lack of volatility as business climates change helps them.
In reality, Southwest’s business is not special. In 2000-2002, Trans World, US Airways, and United Airlines all saw their profits collapse, and had to go into bankruptcy. Southwest wasn’t immune to this collapse though. They saw their operating profit drop from $1 billion to $400 million, a 60% drop.
From 2006 to 2008, another economic disaster sent the industry into another tailspin. Aloha Air, ATA Airlines, and Frontier Airlines all went bankrupt. Eventually American Airlines, the only legacy full-priced airline that had previously avoided bankruptcy entered bankruptcy a few years later. Southwest didn’t go bankrupt, but the company saw operating profit fall from $930 million to $450 million, an over 50% drop. On a Uniform Accounting basis, ROA dropped from around 5% to 2%.
Southwest’s operations aren’t special, they have been just as volatile as every other airline. Southwest’s secret weapon is their capital structure. Specifically that they are constitutionally allergic to the four letter word that has brought down all the other airlines.
Debt.
In the past 20 years, the lowest interest coverage ratio the company has (EBITDA / interest expense) has been 7.1x, in 2009. That year the company had $3.4 billion in debt on their balance sheet, and $2.6 billion in cash on their balance sheet. If they had needed to, they could have shrunk that debt down by over 75%, in which case their interest coverage ratio would have been 28.4x.
Southwest understood something many of their peers either didn’t, or chose to ignore. Highly cyclical companies should never put themselves in a situation to be highly levered.
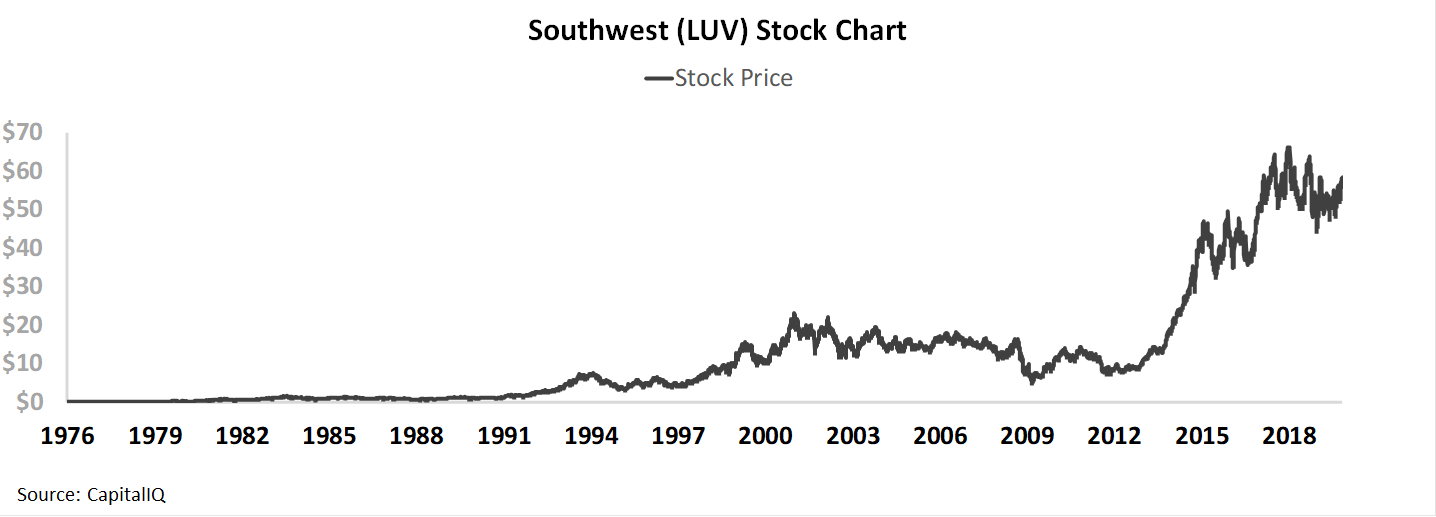
Just by following that insanely simple rule, Southwest’s stock is up 238,046% over the past 40 years.
We couldn’t tell you how much any of their peers’ stocks are up, they’ve all gone bankrupt at least once, if not multiple times in that period.
While GM and Chrysler both went bankrupt in the Great Recession, Ford (F) is also the only of the big 3 car manufacturers who has avoided bankruptcy.
Ford certainly saw terrible operations going into and during the Great Recession. They had NEGATIVE $12 billion of operating losses in 2006, and negative $6.5 billion in operating losses in 2008.
Similar to Southwest, the reason why they survived had to do with being savvy with their capital structure. But Ford was savvy in a different way.
As Ford was about to report Q4 2018 earnings, after surviving the brunt of the credit crisis, they knew they were going to be reporting a $5.9 billion loss, and knew investors would be panicked about their operations. So Ford bolstered their balance sheet in a non-intuitive way.
Ford drew down $10.1 billion from their revolving facilities from a group of banks. They were concerned about some of their lenders’ balance sheets, so they decided to draw down their loans from the banks before they had to worry about being able to access them.
By doing that, Ford dramatically improved their short-term liquidity, at a time when the stock was trading below $2 a share, putting them on firm footing to survive the rest of the Great Recession.
It was Ford’s savvy capital structure management, not their operational differences with their peers, that allowed them to continue to operate. And now the stock is 4.5x higher than it was when they made that smart move to manage those operational headwinds.
Right now though, the market is again pricing Ford like they’re under operational and credit pressures, as the company is trading at a significant discount to Uniform Asset values. Ford is trading at a 0.7x Uniform Price/Book asset valuation. We normally only see valuations below these levels when a company is a bankruptcy risk.
Assuming Ford doesn’t go bankrupt, the company appears to be trading at closer to a valuation floor than a ceiling. Combine these very pessimistic valuations and management’s confidence in recent earnings calls about their operational improvement initiatives and their international growth, and Ford may be being misunderstood again.
Market expectations are for Uniform ROA to fall, but management is confident about their business transformation and international expansion
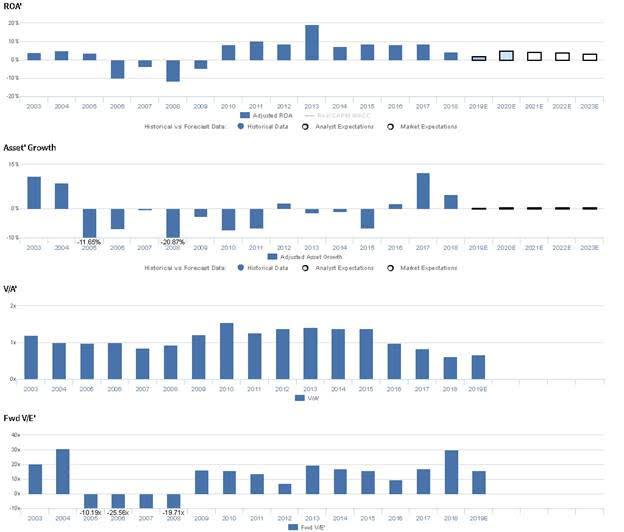
F currently trades below corporate averages relative to UAFRS-based (Uniform) Earnings, with a 15.7x Uniform P/E. At these levels, the market is pricing in expectations for Uniform ROA to contract from 5% in 2018 to 3% in 2023, accompanied by 1% Uniform Asset growth going forward.
However, analysts have more bullish expectations, projecting Uniform ROA to sustain 5% levels through 2020, accompanied by immaterial Uniform Asset growth.
Historically, F has seen somewhat cyclical, though generally improving profitability. From 2003-2005, the firm saw Uniform ROA sustain 4%-5%, before declining to negative levels through 2009. Then, in 2010, Uniform ROA inflected positively to 8%, before improving further to 19% in 2013. However, Uniform ROA then fell to 7%-9% levels from 2014 through 2017, before contracting to 5% in 2018. Meanwhile, Uniform Asset growth has been volatile, positive in six of the past 16 years, and ranging from -21% to 12%.
Performance Drivers – Sales, Margins, and Turns
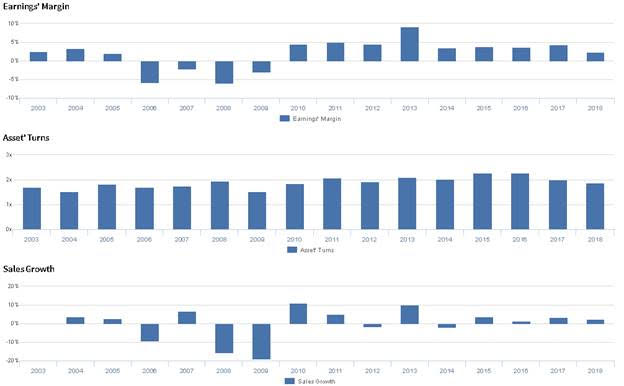
Cyclicality in Uniform ROA have been driven by trends in Uniform Earnings Margin, and to a lesser extent, Uniform Asset Turns. From 2003-2005, Uniform Margins sustained 2-3% levels, before inflecting to negative levels from 2006 to 2009. Subsequently, Uniform Margins jumped to 5% in 2010, and soared to 9% levels by 2013. Uniform Margins then fell to 4% levels from 2014 to 2017, before sliding to 2% in 2018. Meanwhile, Uniform Turns rose from 1.7x in 2003 to 1.9x in 2008, before fading to 0.5x in 2009. Then, Uniform Turns subsequently recovered to 2.3x levels in 2015-2016 and slid back to 1.9x levels in 2018. At current valuations, markets are pricing in expectations for both Uniform Margins and Uniform Turns to continue falling.
Earnings Call Forensics
Valens’ qualitative analysis of the firm’s Q3 2019 earnings call highlights that management is confident they are transforming into a more agile, customer-centric firm, and they generated multiple highly confident markers about their profitability growth in China. Furthermore, they are confident their joint venture with Mahindra will drove profitability in India.
However, management may be concerned about headwinds in Q4 impacting profitability and about rising warranty costs from older vehicles. Furthermore, they may be exaggerating the improvements to their Ford Credit program, and they may lack confidence in their ability to sustain recent improvements in Ford Credit earnings.
UAFRS VS As-Reported
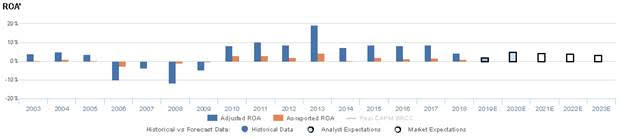
Uniform Accounting metrics also highlight a significantly different fundamental picture for F than as-reported metrics reflect. As-reported metrics can lead investors to view a company to be dramatically stronger or weaker than real operating fundamentals highlight. Understanding where these distortions occur can help explain why market expectations for the company may be divergent.
As-reported metrics significantly understates F’s profitability. For example, as-reported ROA for F was 1% in 2018, materially lower than Uniform ROA of 5%, making F appear to be a much weaker business than real economic metrics highlight. Moreover, as-reported ROA has improved from immaterial levels in 2014 to 1% in 2018, while Uniform ROA has fallen from 7% to 5% over the same period, directionally distorting the market’s perception of the firm’s profitability over the past five years.
Today’s Tearsheet
Today’s tearsheet is for Abbott Labs. Abbott Labs trades at a slight premium to market average valuations. The company has recently had robust Uniform EPS growth, and EPS growth is forecast to remain robust going forward. At current valuations, the market is pricing in the company having slower earnings growth going forward than is forecast. The company’s earnings growth for 2019 is above peer average levels, and the company is trading at a discount to peer average valuations. The company has strong returns, with no risk to their dividend.
Regards,
Joel Litman
Chief Investment Strategist


