
At a Uniform P/E of 10.9x, this piso-fare pioneer is also showing deeply discounted valuations, but watch out for its takeoff in the near future.

The fight-or-flight response is defined to be the hormonal reaction when one’s survival is threatened. The recent COVID-19 health crisis in the Philippines has triggered many investors’ fight-or-flight responses. Many are choosing to flee
The company highlighted today has been one of those most affected by such events, causing their stock price to plummet by almost half since the start of the year.
The market may be overly bearish, perhaps because as-reported metrics have indicated that this budget airline has a good chance of facing complete grounding for a long while.
However, TRUE UAFRS-based (Uniform) metrics are showing healthier financials, where it is likely that they can bear any headwinds in the near future. Therefore, current valuation implies a stock take-off once conditions normalize.
Also below, Uniform Accounting Embedded Expectations Analysis and the Uniform Accounting Performance and Valuation Tearsheet for the company.
Philippine Markets Daily:
Tuesday Uniform Earnings Tearsheets – Philippine-listed Focus
Powered by Valens Research
In terms of value for money, no promo comes close to what the “Piso Fare” offers. For this reason, it has become one of the Philippines’ most anticipated and sought after sales.
While we don’t really pay a peso for the entire trip, this deal makes it so ridiculously cheap to travel that we wonder how the company even manages to turn a profit.
Cebu Air, Inc. (CEB:PHL, aka Cebu Pacific), the creator of the piso fare promo, was established for this reason, to address the need for a budget airline in the Philippines.
Emulating the Southwest Airline business model, the strategy is to keep costs and prices as low as possible by removing the nonessentials from the flight experience.
Passengers are instead charged extra for food, refreshments, and additional luggage. The airline also takes on shorter routes and lands on cheaper airports to minimize expenses.
This way, they attract the low-budget high frequency flyers, hoping that these customers will generate the same amount of revenue as the wealthier low frequency passengers.
Furthermore, what Cebu Pacific has got going for them is a substantially larger customer base than that of traditional airlines.
However, this is a double-edged sword. Numerous instances of cancellations can quickly eat into the firm’s earnings, since they operate on such low margins.
We are currently seeing the negative case play out, as the coronavirus has scared the world. People are delaying travel plans, businesses are shutting down operations, and governments are restricting movement in and out of their borders.
Reasonably, this has had an effect on Cebu Pacific’s operations and, ultimately, their stock price. Yet, the market may be too bearish on the firm, exaggerating Cebu Pacific’s inability to bounce back.
Year-to-date, the company is trading almost half of where it once was, from PHP 88 to PHP 48. This calculates to a 10.9x Uniform P/E, way below corporate and historical averages.
As-reported metrics give the impression that Cebu Pacific has merely earned cost-of-capital returns of 4%, providing no economic value to shareholders.
Taking COVID-19 concerns into account, where the company has been recently forced to lay off new hires, investors are expecting Cebu Pacific to dip into negative territory.
Meanwhile, Cebu Pacific’s TRUE Earning power of 7% is saying otherwise, that the company is far from problematic levels, possibly even with the current headwinds.
One of the main contributing factors to such earnings disparity is how interest expense is accounted for.
In the calculation of Uniform metrics, interest expense is added back to the firm’s earnings in order to provide an honest comparison of its performance relative to peers, regardless of the amount of leverage.
This way, we get to truly see which is a better performer and which trades at a higher or lower multiple.
Cebu Pacific’s earning power is stronger than you think
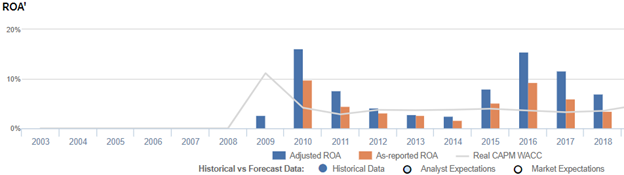
Historically, Cebu Pacific has seen cyclical profitability. In 2010, when Cebu Pacific became the largest carrier in the Philippines, carrying 37% of the country’s total capacity, the firm’s Uniform return on assets (ROA) (blue bars) rose to 16% levels.
However, the company’s profitability started to fall in 2011 due to higher fuel costs, then reached below cost-of-capital levels beginning 2012 to 2014 ranging 3%-4% levels.
In 2016, with the help of lower fuel prices, Cebu Pacific’s profitability recovered to 15% levels, but this recovery did not last as the company once again saw declining profitability, sitting at 7% levels.
Although the trend in Uniform return on assets (ROA) (blue bars) has been similar to as-reported ROA (orange bars), traditional metrics have significantly understated the company’s profitability.
Cebu Pacific’s earnings margin is weaker than you think
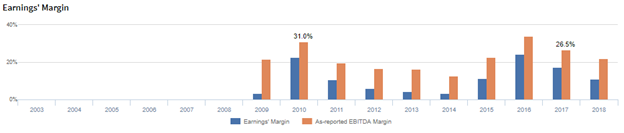
Typical for a budget airline, Cebu Pacific’s Uniform earnings margin have been cyclical and lower than what as-reported metrics state. This implies that the company is less concerned about setting prices as high as possible.
From 2010-2014, Uniform earnings margin declined from 23% to its lowest growth of 3% levels in 2014. Thereafter, Uniform earnings margin slowly recovered and reached new highs of 24% in 2016, before dropping again to 11% in 2018.
Every year, as-reported earnings margins have been overstated, significantly distorting where the company has relied on for their earnings.
At current valuations, markets are pricing in expectations for stability in Uniform earnings margin and rebound in Uniform asset turns.
SUMMARY and Cebu Air, Inc. Tearsheet
As our Uniform Accounting tearsheet for Cebu Pacific highlights, Uniform P/E trades at 10.9x, which is below market average and historical average levels.
Low P/Es require Low EPS growth to sustain them. In the case of Cebu Pacific, the company has recently shown 40% Uniform EPS shrinkage.
Sell-side analysts provide stock and valuation recommendations that in general provide very poor guidance or insight. However, sell-side analysts’ near-term earnings forecasts tend to have relevant information.
We take sell-side forecasts for Philippine Financial Reporting Standards (PFRS) earnings and convert them to Uniform earnings forecasts. When we do this, Cebu Pacific’s sell-side analyst-driven forecast is for a robust Uniform earnings of 70% in 2019, before a shrinkage in 2020.
Based on current stock market valuations, we can back into the required earnings growth rate that would justify PHP 48.00 per share. These are often referred to as market embedded expectations.
To meet the current market valuation levels of Cebu Pacific, the company would need to shrink its Uniform earnings by 5% each year over the next three years.
What sell-side analysts expect for Cebu Pacific’s earnings growth is above than the current stock market valuation requires in 2019.
The company’s earning power is slightly above the corporate average, yet the company has high dividend risk, signaling that their cash flow risk to the company’s operations and credit profile in the future is low.
To conclude, Cebu Pacific’s Uniform earnings growth is above peer averages in 2019, and the company is trading below peer valuations.
About the Philippine Markets Daily
“Tuesday Uniform Earnings Tearsheets – Philippine-listed Focus”
Some of the world’s greatest investors learned from the Father of Value Investing or have learned to follow his investment philosophy very closely. That pioneer of value investing is Professor Benjamin Graham. His followers:
Warren Buffett and Charles Munger of Berkshire Hathaway; Shelby C. Davis of Davis Funds; Marty Whitman of Third Avenue Value Fund; Jean-Marie Eveillard of First Eagle; Mitch Julis of Canyon Capital; just to name a few.
Each of these great investors studied security analysis and valuation, applying this methodology to manage their multi-billion dollar portfolios. They did this without relying on as-reported numbers.
Uniform Adjusted Financial Reporting Standards (UAFRS or Uniform Accounting) is an answer to the many inconsistencies present in GAAP and IFRS, as well as in PFRS.
Under UAFRS, each company’s financial statements are rebuilt under a consistent set of rules, resulting in an apples-to-apples comparison. Resulting UAFRS-based earnings, assets, debts, cash flows from operations, investing, and financing, and other key elements become the basis for more reliable financial statement analysis.
Every Tuesday, we focus on one Philippine-listed company that’s particularly interesting from a UAFRS vs as-reported standpoint. We highlight one adjustment that illustrates why the as-reported numbers are unreliable.
This way, we gain a better understanding of the factors driving a particular stock’s returns, and whether or not the firm’s true profitability is reflected in its current valuations.
Hope you’ve found this week’s Uniform Earnings Tearsheet on a Philippine company interesting and insightful.
Stay tuned for next week’s Philippine company highlight!
Regards,
Angelica Lim & Joel Litman
Research Director & Chief Investment Strategist
Philippine Markets Daily
Powered by Valens Research
www.valens-research.com


