
Contrary to what research says, this company’s acquisitions actually enhanced shareholder value, with Uniform ROAs climbing to new highs

It is widely known in the financial academia that acquisitions, more often than not, will destroy shareholder value for the acquiring company for one primary reason: overpaying for the target.
When this healthcare company set out to transform its business through two acquisitions that totaled $90 billion, the market thought that it would be just another number in the statistic.
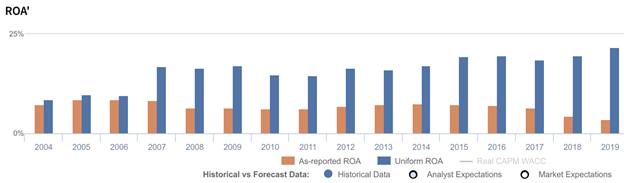
As-reported metrics confirmed the market’s suspicion, with ROAs falling from 9% pre-acquisition, to just 4%. However, Uniform Accounting reveals that the company’s acquisitions have actually created shareholder value, with Uniform ROAs going up from 10% to 22% in the same time frame.
Also below, Uniform Accounting Embedded Expectations Analysis and the Uniform Accounting Performance and Valuation Tearsheet for the company.
Philippine Markets Daily:
Thursday Uniform Earnings Tearsheets – Global Focus
Powered by Valens Research
Data from academic research concludes that acquisitions almost always destroy shareholder value. It shows that upwards of 60% of acquisitions have been net negative for the acquirer in terms of added value to the firm.
Many reasons have been cited as to why that is the case, which includes failure to successfully integrate both operations, misaligned management, and, the most prominent of them all, the acquirer overpaying for the target.
Valuation for acquisitions usually leaves significant leeway for subjective inputs. The premium, specifically, or how much the acquiring company is willing to pay for the synergies, is easy to overestimate.
The reason why synergy estimates are often much more optimistic than what the acquiring company would likely achieve is because some of these are based on non-financial forecasts, e.g. supply chain improvements, widened potential market, and so on.
So when an acquirer overpays, not only does it cost them millions (or even billions), but if they fail to realize the synergies priced in by the premium, it will also negatively impact the company’s reputation. In which case, both tangible and intangible shareholder value is lost.
Take Quaker’s $1.7 billion acquisition of Snapple, for example. Quaker thought that it could use its vast distribution channel to boost Snapple’s growth. When those synergies didn’t materialize as expected, sales tanked, and Quaker was forced to sell Snapple for $300 million or a loss of $1.4 billion.
The numbers prove that making acquisitions destroys shareholder value more likely than not, and yet, a lot of firms still do it. It’s because acquisitions can diversify a company’s products and services, open it up to a wider market, enable the company to realize operational and financial efficiencies…the list goes on.
CVS Health Corporation (CVS) had these things in mind when it acquired Caremark, a company focused on home care services such as mail-order prescriptions, for $21 billion in 2007. CVS expected synergies of about $75 billion in revenues and around $400 million in operational efficiencies from the acquisition.
Caremark was integrated with CVS’ pharmacy benefit management (PBM) business, which enabled CVS to control the dispensing of about one billion prescriptions annually. The acquisition did more than just bring synergies, it also significantly transformed the business—CVS became a retail pharmacy giant AND a PBM powerhouse.
The company continued its business transformation with the acquisition of Aetna, a healthcare company that offers health insurance and related services, for $69 billion in 2017.
Aetna’s claims and patient data, combined with CVS’ pharmacy and PBM data, helps the company offer more holistic value-add solutions for hospitals and other healthcare providers. Basically, CVS, aside from being a retail pharmacy and PBM business, also became a powerful data analytics firm.
Both of CVS’ acquisitions have transformed its business tremendously. However, the question remains: was the transformation enough to justify the exorbitant purchase costs?
As-reported metrics show that since the 2007 Caremark acquisition, ROAs have gone down from 9% levels to 6%-7%. ROAs have gone down further to below cost-of-capital levels of 4% since the Aetna acquisition. It seems that, as the statistics predict, CVS overpaid for its acquisitions, and shareholder value has declined.

In reality, however, Uniform Accounting reveals that the business transformation arising from the acquisitions was more than enough to outweigh the purchase cost. Uniform ROAs have risen from pre-acquisition levels of 9% to current 20%+ highs, creating a net positive value for shareholders.
The huge distortion between Uniform and as-reported ROAs can be explained from as-reported metrics failing to consider the amount of goodwill on CVS’ balance sheet. In recent years, goodwill averaged about $80 billion or a third of its total assets, due to the company’s acquisition activities.
Goodwill is an intangible asset that is purely accounting-based and unrepresentative of the company’s actual operating performance. When as-reported accounting includes this in a company’s balance sheet, it creates an artificially inflated asset base.
As a result, as-reported ROAs are not capturing the strength of CVS’ earning power. Adjusting for goodwill, we can see that the company didn’t make value-destroying decisions. In fact, it has been the opposite, driving returns that are 2x-5x greater.
CVS’ earning power is actually more robust than you think
As-reported metrics distort the market’s perception of the firm’s recent profitability. If you were to just look at as-reported ROA, you would think that the company is a much weaker business than real economic metrics highlight.
CVS’ Uniform ROA has actually been higher than its as-reported ROA in the past sixteen years. For example, as-reported ROA was 4% in 2019, but its Uniform ROA was actually over 5x higher at 22%.
In fact, CVS’ Uniform ROA has ranged from 9%-22% in the past sixteen years while as-reported ROA ranged from only 4%-9% in the same time frame.
After expanding from 9%-10% levels in 2004-2006 to 17% levels in 2007-2009, Uniform ROA declined to 15%-16% levels in 2010-2013, before improving to a peak of 22% in 2019.
CVS’ Uniform earnings margins are weaker than you think, but its robust Uniform asset turns make up for it
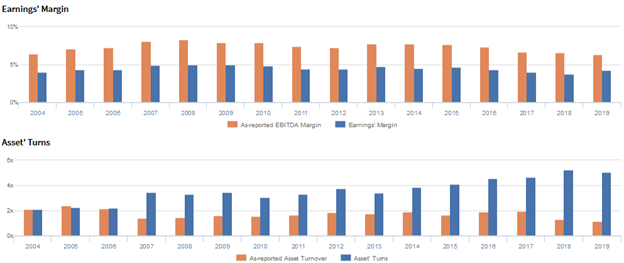
CVS’ trends in Uniform ROA have been driven by improving Uniform asset turns.
From 2004 to 2006, Uniform turns ranged between 2.1x and 2.2x before jumping to 3.4x in 2007, following the Caremark acquisition. Then, from 2008 to 2011, Uniform turns remained at 3.1x-3.4x levels before climbing to a peak of 5.2x in 2018 and then slightly compressing to 5.1x in 2019.
Meanwhile, since 2004, Uniform margins have consistently ranged from 4%-5%.
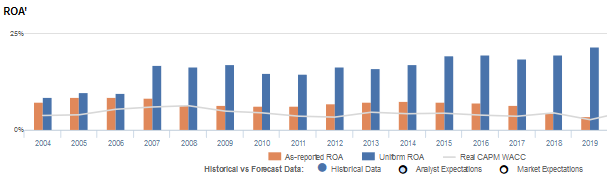
At current valuations, markets are pricing in an expectation for continued declines in Uniform turns, accompanied by continued stability in Uniform margins.
SUMMARY and CVS Health Corporation Tearsheet
As the Uniform Accounting tearsheet for CVS Health Corporation (CVS) highlights, the Uniform P/E trades at 12.9x, which is below corporate average valuation levels, but around its own recent history.
Low P/Es require low EPS growth to sustain them. In the case of CVS, the company has recently shown a 7% Uniform EPS contraction.
Wall Street analysts provide stock and valuation recommendations that provide very poor guidance or insight in general. However, Wall Street analysts’ near-term earnings forecasts tend to have relevant information.
We take Wall Street forecasts for GAAP earnings and convert them to Uniform earnings forecasts. When we do this, CVS’ Wall Street analyst-driven forecast is a 21% EPS growth in 2020 followed by a 2% EPS shrinkage in 2021.
Based on current stock market valuations, we can use earnings growth valuation metrics to back into the required growth rate to justify CVS’ $60 stock price. These are often referred to as market embedded expectations.
The company can have Uniform earnings shrink by 6% each year over the next three years and still justify current prices. What Wall Street analysts expect for CVS’ earnings growth is above what the current stock market valuation requires in 2020 and 2021.
Furthermore, the company’s earning power is 4x the corporate average. Also, cash flows and cash on hand are 2x higher than its total obligations—including debt maturities, capex maintenance, and dividends. Together, this signals a low credit and dividend risk.
To conclude, CVS’ Uniform earnings growth is below its peer averages in 2020 and the company is also trading below its average peer valuations.
About the Philippine Market Daily
“Thursday Uniform Earnings Tearsheets – Global Focus”
Some of the world’s greatest investors learned from the Father of Value Investing or have learned to follow his investment philosophy very closely. That pioneer of value investing is Professor Benjamin Graham. His followers:
Warren Buffett and Charles Munger of Berkshire Hathaway; Shelby C. Davis of Davis Funds; Marty Whitman of Third Avenue Value Fund; Jean-Marie Eveillard of First Eagle; Mitch Julis of Canyon Capital; just to name a few.
Each of these great investors studied security analysis and valuation, applying this methodology to manage their multi-billion dollar portfolios. They did this without relying on as-reported numbers.
Uniform Adjusted Financial Reporting Standards (UAFRS or Uniform Accounting) is an answer to the many inconsistencies present in GAAP and IFRS, as well as in PFRS.
Under UAFRS, each company’s financial statements are rebuilt under a consistent set of rules, resulting in an apples-to-apples comparison. Resulting UAFRS-based earnings, assets, debts, cash flows from operations, investing, and financing, and other key elements become the basis for more reliable financial statement analysis.
Every Thursday, we focus on one multinational company that’s particularly interesting from a UAFRS vs as-reported standpoint. We highlight one adjustment that illustrates why the as-reported numbers are unreliable.
This way, we gain a better understanding of the factors driving a particular stock’s returns, and whether or not the firm’s true profitability is reflected in its current valuations.
Hope you’ve found this week’s Uniform earnings tearsheet on a multinational company interesting and insightful.
Stay tuned for next week’s multinational company highlight!
Regards,
Angelica Lim
Research Director
Philippine Markets Daily
Powered by Valens Research
www.valens-research.com


