
MONDAY MACRO: Uniform Accounting shows how Philippine corporates have been more cost and asset efficient than you may think

Now knowing how corporations listed in the Philippine Stock Exchange (PSE) actually performed in 2020, it would be beneficial to look at the drivers of Uniform ROA.
While as-reported metrics may give the idea that Philippine corporates were only relying on margins to generate earnings growth, Uniform data shows even turns were actually causing ROA improvements.
Philippine Markets Daily:
The Monday Macro Report
Powered by Valens Research
Last week, we discussed what the profitability of companies listed in the PSE actually looked like in 2020. Due to the pandemic, Uniform ROA of Philippine corporations dropped from 7% in 2019 to 4% in 2020.
However, 2020 Uniform ROA still stood higher than as-reported ROA of 3%. In fact, Uniform ROA has been higher than as-reported ROA since 2010.
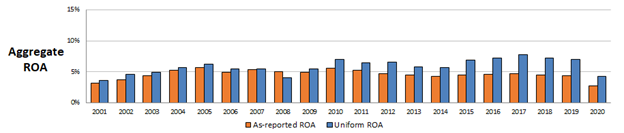
The ROA chart provides a concise picture of the performance of PSE-listed companies, but insights may be further found by looking at the drivers of ROA, which are margins and turns.
Margin is essentially a measure of a company’s cost efficiency–how much profit is earned per peso of sales. Meanwhile, Asset Turns quantify the firm’s asset efficiency–how much revenue is generated per peso spent on assets.
The highest quality companies are those who are efficient in both cost and asset spending, making the entire business operationally efficient.
However, some companies only excel at one. Management teams of some of these companies understand how to reduce costs and offer new products charged at higher prices, but are utilizing too much equipment to manufacture the products.
Other management teams are adept at producing more output with the same or fewer factories but are paying too much for raw materials and overhead.
Looking at the as-reported aggregate ROA of Philippine corporations, it could be concluded that the group falls under one of the mentioned scenarios. In fact, the trends over the past decade show how as-reported margins have been able to stand strong, especially pre-pandemic, while as-reported turns have weakened over the same period.

After rising from 8% in 2001-2002 to a peak of 11% in 2005, as-reported margins faded to 8% in 2013, before recovering to 9%-10% levels from 2015-2019. Since then, however, as-reported margins have fallen back to 8% in 2020.
Meanwhile, as-reported turns ranged from 0.5x-0.6x levels from 2004-2013, before declining to levels below 0.5x and down to 0.35x by 2020.
However, when removing the accounting distortions, both metrics have actually performed better than perceived. This is especially true for the aggregate asset turns of Philippine corporations, where balance sheets are incorrectly filled with excess cash, goodwill, and other items unrepresentative of the firm’s true operating assets.
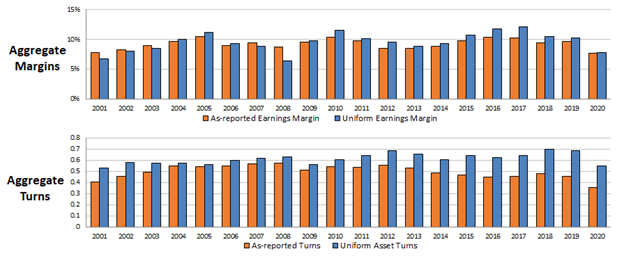
Uniform turns have actually consistently surpassed 0.5x from 2013-2020, even during the pandemic. It even nearly exceeded 0.7x during the years 2018-2019.
Meanwhile, Uniform margins similarly recorded 8% in 2020, but they had been rising to new historical highs prior to that year. As-reported margins were only able to improve to a peak of 11% last 2005, but Uniform margins expanded to record-high 12% levels in 2016-2017.
As a result, as-reported data gives the impression that the PSE-listed companies were struggling overall with asset efficiency when the group was actually utilizing assets better.
Additionally, even though as-reported margins were robust, Philippine corporations were still more cost-efficient than implied.
COVID-19 caused a break from the trends, as both Uniform margins and Uniform turns massively fell from the prior year. Companies had to incur higher costs and operate with less capacity to comply with the quarantine restrictions.
However, as the economy recovers, pandemic-related costs will subside and plant capacity will return to full. As such, Uniform margins and Uniform turns will return to pre-pandemic levels and as-reported metrics will continue to do what it has always done: understate the efficiencies of Philippine corporates.
About the Philippine Markets Daily
“The Monday Macro Report”
When just about anyone can post just about anything online, it gets increasingly difficult for an individual investor to sift through the plethora of information available.
Investors need a tool that will help them cut through any biased or misleading information and dive straight into reliable and useful data.
Every Monday, we publish an interesting chart on the Philippine economy and stock market. We highlight data that investors would normally look at, but through the lens of Uniform Accounting, a powerful tool that gets investors closer to understanding the economic reality of firms.
Understanding what kind of market we are in, what leading indicators we should be looking at, and what market expectations are, will make investing a less monumental task than finding a needle in a haystack.
Hope you’ve found this week’s macro chart interesting and insightful.
Stay tuned for next week’s Monday Macro report!
Regards,
Angelica Lim
Research Director
Philippine Markets Daily
Powered by Valens Research
www.valens-research.com


