
This company’s Uniform ROAs of 10%+ show that you don’t have to run circles around the competition to thrive in the footwear industry

The footwear industry’s growth in the past decade was partly due to the increasing demand for innovative footwear worldwide. Growing sports activity is another driving force for this industry’s growth.
In 2015, this company became one of the largest footwear brands in the United States because of its focus on innovation. Instead of producing the same styles as its peers, it opted to tap into the casual footwear industry.
By staying trendy and comfortable, the company appeals to a broad audience. However, as-reported metrics make it seem like the business is losing its popularity. On the other hand, Uniform Accounting reveals that this company’s returns have been consistently above 10%.
Also below, Uniform Accounting Embedded Expectations Analysis and the Uniform Accounting Performance and Valuation Tearsheet for the company.
Philippine Markets Daily:
Thursday Uniform Earnings Tearsheets – Global Focus
Powered by Valens Research
Footwear has a 40,000-year history dating back to the Middle Paleolithic period. In earlier eras, footwear was only used as a necessity to protect our feet from outside harm.
However, it wasn’t until the latter part of the 20th century that the footwear industry saw a breakthrough.
Shoes were no longer used just out of practicality, but also as fashion statements. Fancy leather and high-heeled footwear became less commonplace. Sneakers, initially used for athletic purposes, rose in popularity as the shoe of choice for everyday casual wear.
We’ve previously talked about how the “athleisure” trend has taken the world by storm. Popularized by companies like Lululemon (LULU:USA), millennials and younger generations have incorporated exercise wear into casual streetwear, creating a trend that highlights these generations’ emphasis on fitness and health.
Skechers (SKX:USA), one of the more well-known sneaker companies, has also benefited from this trend.
Style is one of the largest factors that make a sneaker desirable to consumers. From classic silhouettes to more unique ones, from monochromes to multi-colored ones, the design is what primarily drives a consumer’s decision to purchase a shoe.
Skechers has been focusing on style innovation to keep up with the trends and continue capturing the changing consumer demand. It does so while also sourcing cheaper raw materials to be cost-effective as the industry quickly moves from one trend to another.
The problem is: every other footwear company does this, too.
This industry is a competitive one, with major brands such as Nike (NKE:USA) at the forefront. However, unlike Adidas or Under Armour, Skechers isn’t competing with Nike for the number one spot. In fact, it’s competing in areas where these major brands are not.
Although Skechers is focused on style, the company is placing more emphasis on comfort and affordability. The company is widely known for its memory foam technology that provides extra cushioning, making its shoes comfortable. Plus, while the average Nike or Adidas shoe retails for about $100-$200, the average Skechers shoe retails for about half of that.
Furthermore, a common marketing trend footwear companies employ is product advertisement through celebrity endorsements. Nike and Skechers both partner with sports teams and high-profile athletes from different sports to target athletes and non-athletes alike. However, both companies target an entirely different audience.
Nike’s demographics are mostly men while Skechers’ target is predominantly kids and women. Looking at revenues, about 20% of Nike’s sales come from women’s products, in comparison to Skechers’ 50%.
Additionally, as what you can probably infer from the companies’ celebrity endorsements (Michael Jordan, Kobe Bryant, and Lebron James versus Joe Montana, Sugar Ray Leonard, and Ringo Starr), Skechers pulls in consumers from the 50+ age bracket—which makes sense why comfort is a key component of Skechers’ design.
Skechers also makes use of television commercials to promote its kids’ products such as Twinkle Toes, light-up shoes, and elastic slip-on shoes. It also generates buzz among its consumers through social media initiatives that boost customer interaction.
Overall, Skechers doesn’t need to be a Nike or an Adidas to hold its own thanks to its smart branding and marketing. With a wide presence of over 3,000 stores in over 170 countries and counting, it shows just how the company continues to strive for strategic growth.
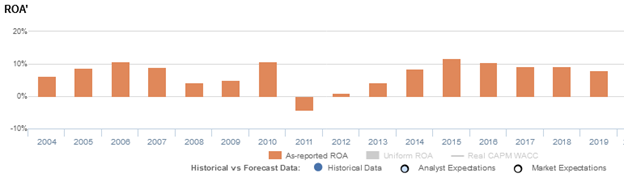
However, looking at as-reported metrics, it appears that Skechers isn’t doing that, with return on assets (ROA) falling from 12% in 2015 to 8% in 2019.
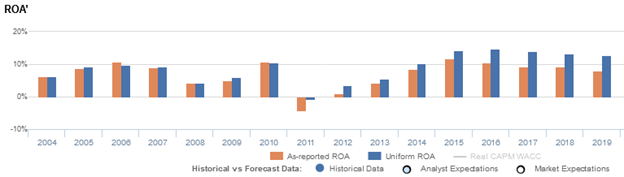
In reality, Uniform Accounting paints a better picture, with Uniform ROAs that are sustained at 13%-15% in the same timeframe.

The distortion comes from as-reported metrics failing to consider the number of operating leases Skechers has from their numerous existing retail stores.
The decision management makes between investing in capex and investing in a lease is based on how management wants to finance their investments. Choosing to lease an asset, however, would not be treated as an investment, but as an expense that would impact the income statement.
Specifically, operating leases on Skechers’ income statement are understating the company’s true earnings. Adjusting for the rent expense distortion, which historically has been about 13% of total operating expenses, returns are actually stronger.
As a result, as-reported ROAs are not capturing the strength of Skechers’ earning power. Adjusting for operating leases, we can see that the company isn’t actually performing poorly, with Uniform ROAs of more than 10%.
Skechers is actually more profitable than you think it is
As-reported metrics distort the market’s perception of the firm’s recent profitability. If you were to just look at as-reported ROA, you would think the company is a much weaker business than real economic metrics highlight.
Skechers’ Uniform ROA has actually been higher than its as-reported ROA in the past nine years. For example, Uniform ROA was 13% in 2019 while as-reported ROA was only at 8%.
Specifically, Skechers’ Uniform ROA has ranged from -1% to 15% in the past nine years while as-reported ROA ranged only from -4% to 12% in the same timeframe.
Uniform ROA increased from 6% in 2004 to 10% in 2006, before falling to 4% in 2008 and rebounding to 11% in 2010. Then, Uniform ROA fell to negative levels in 2011 before gradually improving to 13%-15% levels through 2019.
Skechers’ Uniform asset turns are stronger than you think

Strength in Skechers’ Uniform ROA has been driven by Uniform asset turns.
As-reported asset turnover decreased from 1.6x-1.8x levels in 2004-2008 to 1.2x in 2012, before recovering to 1.4x-1.5x levels in 2014-2018 and contracting to 1.1x in 2019.
Meanwhile, Uniform turns fell from 1.9x-2.0x levels in 2004-2006 to 1.1x in 2012, before expanding to 1.4x-1.6x levels through 2019.
Looking at the firm’s turns alone, as-reported metrics are making the firm appear to be a less asset efficient business than is accurate.
SUMMARY and Skechers U.S.A., Inc. Tearsheet
As the Uniform Accounting tearsheet for Skechers U.S.A., Inc. (SKX:USA) highlights, the Uniform P/E trades at 14.6x, which is below the global corporate average of 25.2x and its historical Uniform P/E of 18.9x.
Low P/Es require low EPS growth to sustain them. In the case of Skechers, the company has recently shown a 15% Uniform EPS growth.
Wall Street analysts provide stock and valuation recommendations that provide very poor guidance or insight in general. However, Wall Street analysts’ near-term earnings forecasts tend to have relevant information.
We take Wall Street forecasts for GAAP earnings and convert them to Uniform earnings forecasts. When we do this, Skechers’ Wall Street analyst-driven forecast is a 60% EPS shrinkage in 2020 followed by a 178% EPS growth in 2021.
Based on current stock market valuations, we can use earnings growth valuation metrics to back into the required growth rate to justify Skechers’ $34 stock price. These are often referred to as market embedded expectations.
The company is currently being valued as if Uniform earnings were to shrink by 4% per year over the next three years. What Wall Street analysts expect for Skechers’ earnings growth is below what the current stock market valuation requires in 2020 but above its requirement in 2021.
Furthermore, the company’s earning power is twice the corporate average. Also, cash flows and cash on hand are about 5x higher than its total obligations—including debt maturities and capex maintenance. Together, this signals a low credit risk.
To conclude, Skechers’ Uniform earnings growth is below its peer averages, and the company is also trading below its average peer valuations.
About the Philippine Markets Daily
“Thursday Uniform Earnings Tearsheets – Global Focus”
Some of the world’s greatest investors learned from the Father of Value Investing or have learned to follow his investment philosophy very closely. That pioneer of value investing is Professor Benjamin Graham. His followers:
Warren Buffett and Charles Munger of Berkshire Hathaway; Shelby C. Davis of Davis Funds; Marty Whitman of Third Avenue Value Fund; Jean-Marie Eveillard of First Eagle; Mitch Julis of Canyon Capital; just to name a few.
Each of these great investors studied security analysis and valuation, applying this methodology to manage their multi-billion dollar portfolios. They did this without relying on as-reported numbers.
Uniform Adjusted Financial Reporting Standards (UAFRS or Uniform Accounting) is an answer to the many inconsistencies present in GAAP and IFRS, as well as in PFRS.
Under UAFRS, each company’s financial statements are rebuilt under a consistent set of rules, resulting in an apples-to-apples comparison. Resulting UAFRS-based earnings, assets, debts, cash flows from operations, investing, and financing, and other key elements become the basis for more reliable financial statement analysis.
Every Thursday, we focus on one multinational company that’s particularly interesting from a UAFRS vs as-reported standpoint. We highlight one adjustment that illustrates why the as-reported numbers are unreliable.
This way, we gain a better understanding of the factors driving a particular stock’s returns, and whether or not the firm’s true profitability is reflected in its current valuations.
Hope you’ve found this week’s Uniform earnings tearsheet on a multinational company interesting and insightful.
Stay tuned for next week’s multinational company highlight!
Regards,
Angelica Lim
Research Director
Philippine Markets Daily
Powered by Valens Research
www.valens-research.com


