
This Japanese company broadened its route networks through partnerships, resulting in Uniform ROAs of 6%+ levels

This Japanese company’s continual growth was driven by strong partnerships in the international arena, which opened the company up to larger route networks and airline sub-industries.
However, as-reported metrics do not seem to reflect this company’s efforts to grow its consumer base. Uniform Accounting shows that the business has better Uniform return on assets (ROA) than what you might think.
Also below, Uniform Accounting Embedded Expectations Analysis and the Uniform Accounting Performance and Valuation Tearsheet for the company.
Philippine Markets Daily:
Wednesday Uniform Earnings Tearsheets – Asia-listed Focus
Powered by Valens Research
Last year, we highlighted one of Asia’s top airlines, Singapore Airlines, in our first-ever Wednesday article. We discussed how the Wright brothers—Orville and Wilbur—pioneered the general idea of aviation by building and flying the world’s first motor-operated plane. This eventually led to the creation of heavier and air-powered aircrafts.
Through the years, plane designs became more sophisticated as larger numbers of people and cargo began to be transported using aircraft. Engines and composite airframes were also further developed, resulting in airplanes becoming quieter and more efficient.
Now, air travel has become one of the most popular modes of transportation. The most significant change in air travel was the massive increase in flights driven by the rise of low-cost carriers (LCC), which does away with the traditional airline services in exchange for lower fares. By 2018, the surge of international flights peaked at 1.4 billion travellers, with some of their most popular destinations being Europe and Asia.
Today’s company comes from one of Asia’s most competitive travel economies, Japan.
Japan Airlines was established in 1951 with the purpose of offering independent air transportation services on domestic routes. Since then, the company has grown to become one of the leaders in the Asia-Pacific airline industry.
Japan Airlines grew by creating strong working relationships with its partners.
In 2007, the company became a member of Oneworld, an alliance that connects premier international airlines together. This partnership opened a much broader route network for Japan Airlines with Oneworld, which currently has 14 members and around 1,000 airports in 170 countries.
Interestingly, during its bankruptcy crisis in 2009, Japan Airlines was able to stay afloat with the help of its fellow Oneworld members, particularly American Airlines, which agreed to continue investing in the company during the restructuring process.
In 2012, Japan Airlines positioned itself in the LCC market through a joint venture agreement with Australian flag carrier, Qantas. This led to the creation of Jetstar Japan and since its establishment, this airline has become one of the largest in Japan’s domestic LCC market with a current market share of 35.5%.
In 2017, Japan Airlines also made a strategic investment in Boom Supersonic to extend its reach in commercial supersonic travel, with the goal of designing a new supersonic commercial jet that would redefine speed travel to their clients.
Looking at Japan Airlines’ strategy of broadening its route networks and tapping into different sub-industries through partnerships and investments, investors would reasonably expect high returns from the company. After all, these initiatives would have resulted in consumer base growth. However, as-reported metrics reflect moderate returns with ROAs ranging only from 3% to 11%.
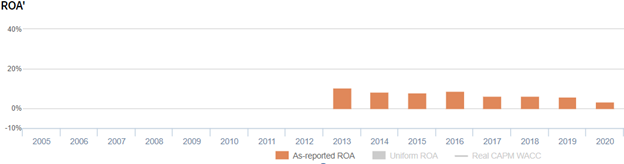
Using Uniform Accounting, a clearer profitability narrative is uncovered. Specifically, the company’s Uniform returns are consistently double its as-reported metrics. For example, while as-reported ROA was only at 11% in 2013, Uniform ROA was actually at 36%.

One key metric that is causing distortions in as-reported ROAs is minority interest expense.
Minority interest expense is the portion of the company’s total earnings that is attributed to its minority shareholders. These minority shareholders are investors or other organizations that own less than 50% of the company.
Japan Airlines regularly reports minority interest expenses, ranging from 1% to 72% of non-operating expenses, which are deducted from the company’s total earnings. This is done to account for the part of the earnings that is allocated to the company’s minority shareholders.
However, removing minority interest expenses from a company’s net income does not show its performance as a whole, making the company’s profitability appear substantially weaker than it actually is. By adding it back to the company’s net income, we can see the company’s true earning power as a whole and not just a part of it.
After adjusting for minority interest expense and applying other adjustments, we can see that Japan Airlines’ ROA doesn’t just perform at 6% levels. In fact, its Uniform returns are more than 3x stronger than what the market thinks.
Japan Airlines’ profitability is more robust than you think

As-reported metrics are distorting the market’s perception of the firm’s profitability. If you were to just look at as-reported ROA, you would think that the company is a weaker business than real economic metrics reveal.
Japan Airlines’ Uniform ROA has been higher than its as-reported ROA in the past nine years. For example, when Uniform ROA was at 18% in 2017, as-reported ROA was only 6%
The company’s Uniform ROA for the past nine years has ranged from 18% to 43%, while as-reported ROA has ranged only from 3% to 11% in the same timeframe.
Specifically, Uniform ROA fell from 43% in 2012 to 18% levels in 2017 to 2018. It then rebounded to 23% levels in 2019, before declining to 6% in 2020.
Japan Airlines’ Uniform earnings margin are weaker than you think but its robust Uniform asset turns make up for it
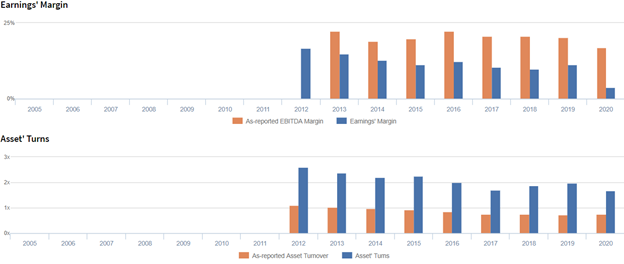
Volatility in Uniform ROA has been driven by trends in both Uniform earnings margins and Uniform asset turns, with peaks and troughs lining up historically with that of Uniform ROA.
Uniform margins steadily declined from 17% in 2012 to 11% in 2015, before remaining at 10% to 12% levels from 2016 to 2019. It then declined to 4% in 2020.
Meanwhile, Uniform turns gradually fell from 2.6x in 2012 to 1.7x in 2017. It then rebounded to 2.0x in 2019 before compressing to 1.7x in 2020.
SUMMARY and Japan Airlines Co., Ltd. Tearsheet
As the Uniform Accounting tearsheet for Japan Airlines Co., Ltd. (9201:JPN) highlights, the Uniform P/E trades at -10.9x, which is below the global corporate average of 25.2x and its own historical average of 4.1x.
Low P/Es require low EPS growth to sustain them. That said, in the case of Japan Airlines, the company has recently shown a 71% Uniform EPS decline.
Sell-side analysts provide stock and valuation recommendations that in general provide very poor guidance or insight. However, sell-side analysts’ near-term earnings forecasts tend to have relevant information.
We take sell-side forecasts for Japan’s Modified International Standards (JMIS) earnings and convert them to Uniform earnings forecasts. When we do this, Japan Airlines’ sell-side analyst-driven forecast is a 665% and 85% EPS decline in 2021 and 2022, respectively.
Based on the current stock market valuations, we can use earnings growth valuation metrics to back into the required growth rate to justify Japan Airlines’ JPY 2,000 stock price. These are often referred to as market embedded expectations.
Japan Airlines is currently being valued as if Uniform earnings were to grow 2% annually over the next three years. What sell-side analysts expect for Japan Airlines’ earnings growth is below what the current stock market valuation requires in 2021 and 2022.
Furthermore, the company’s earning power is 1x above the long-run corporate average. Also, cash flows and cash on hand are significantly above its total obligations—including debt maturities, and capex maintenance. All in all, this signals a low credit and dividend risk.
To conclude, Japan Airlines’ Uniform earnings growth is on par with its peer averages, and the company is also trading in line with its average peer valuations.
About the Philippine Markets Daily
“Wednesday Uniform Earnings Tearsheets – Asia-listed Focus”
Some of the world’s greatest investors learned from the Father of Value Investing or have learned to follow his investment philosophy very closely. That pioneer of value investing is Professor Benjamin Graham. His followers:
Warren Buffett and Charles Munger of Berkshire Hathaway; Shelby C. Davis of Davis Funds; Marty Whitman of Third Avenue Value Fund; Jean-Marie Eveillard of First Eagle; Mitch Julis of Canyon Capital; just to name a few.
Each of these great investors studied security analysis and valuation, applying this methodology to manage their multi-billion dollar portfolios. They did this without relying on as-reported numbers.
Uniform Adjusted Financial Reporting Standards (UAFRS or Uniform Accounting) is an answer to the many inconsistencies present in GAAP and IFRS, as well as in PFRS.
Under UAFRS, each company’s financial statements are rebuilt under a consistent set of rules, resulting in an apples-to-apples comparison. Resulting UAFRS-based earnings, assets, debts, cash flows from operations, investing, and financing, and other key elements become the basis for more reliable financial statement analysis.
Every Wednesday, we focus on one company listed in Asia that’s relevant to the Philippines and that’s particularly interesting from a UAFRS vs as-reported standpoint. We highlight one adjustment that illustrates why the as-reported numbers are unreliable.
This way, we gain a better understanding of the factors driving a particular stock’s returns, and whether or not the firm’s true profitability is reflected in its current valuations.
Hope you’ve found this week’s Uniform Earning Tearsheet on an Asian company interesting and insightful.
Stay tuned for next week’s Asia company highlight!
Regards,
Angelica Lim
Research Director
Philippine Markets Daily
Powered by Valens Research
www.valens-research.com


