
This “king” has conquered many industries through diversification, with a TRUE earning power that’s almost 3x than what you think!

According to Father of Strategic Management Igor Ansoff, there are four major areas that companies can focus on to grow: market penetration, market development, product development, and diversification.
This Taiwanese company focused on diversification to increase its client acquisition rate by entering markets where it could easily integrate its products. It was able to identify “the next big thing” and acted quickly to establish its presence in those markets.
However, if we look at as-reported metrics, we’ll see a company that does not seem to have benefited from its diversification strategies. Uniform Accounting, on the other hand, shows a firm with stronger returns that justify the company’s growth decisions.
Also below, Uniform Accounting Embedded Expectations Analysis and the Uniform Accounting Performance and Valuation Tearsheet for the company.
Philippine Markets Daily:
Wednesday Uniform Earnings Tearsheets – Asia-listed Focus
Powered by Valens Research
The Ansoff Matrix is a commonly used tool in strategic planning to determine the areas management needs to focus on to drive growth, as well as which resources should be used. It also helps management teams understand where risk is higher for the firm.
Ansoff proposed four basic growth strategies that a firm could take:
- Market Penetration (existing market, existing products/services)
- Market Development (new market, existing products/services)
- Product Development (existing market, new products/services)
- Diversification (new products, new markets)
Conservative management teams might choose the market penetration strategy to increase revenues for the firm. They could do this by ramping up their marketing efforts or acquiring another company in the space.
The strategy with the highest risks involved is the diversification strategy, which means developing new products AND entering new markets. Companies can achieve this by acquiring a new product or another company in the target industry. The company can also diversify by branching out to similar industries or by even entering an entirely different and unrelated field.
Among these four strategies, it’s the diversification strategy that offers the greatest potential for massive revenue growth because of the entirely new market the company will tap.
That higher-risk strategy is what King Slide implemented just a few years after consumers started to gain access to the internet for their personal consumption.
King Slide Works Co., Ltd. started as a foundry in 1986, to engage in the manufacturing of furniture hardware.
Realizing there was an opportunity for growth with the increasing relevance of IT infrastructure, King Slide focused its efforts on diversifying its products. By 2000, it had successfully developed rail kit solutions for the IT industry in Taiwan. Its rail products were then used in other areas of the servers and peripheral products market such as network communications and cloud data centers.
Thanks to its expertise in mechanisms and rails, King Slide became the second-largest server rail brand in the world, currently holding around 30% of total market share, and with over 1,000 product patents. Global server shipments are expected to grow by 5.0%-6.5% a year by 2024, a tailwind King Slide can comfortably ride on.
After its successful diversification initiative into server rails in the early 2000s, King Slide set its sights once more on reaping the rewards of this growth strategy. The company looked to something closer to its roots though also a little bit different.
As people spend more time in their homes and invest more in improving their homes thanks to the Internet of Things (IoT), one particular segment is seeing double digit growth–the kitchenware market.
The global kitchenware market is expected to grow by 4.5% a year until 2025, presenting King Slide another growth opportunity. With “smart kitchens” leading the growth, consumers have turned to products that are both functional and stylish, two characteristics of King Slide’s drawer systems.
King Slide heavily invests in research and development, global product maintenance, and patent applications to ensure it will be profitable in any of its businesses. However, if we were to look at the company’s as-reported metrics, we’ll see a company that is not actually benefiting from its diversification strategies. Its as-reported returns have been consistently weak, currently at just 10%-11% levels in recent years.

This is a misrepresentation of King Slide’s profitability. Uniform Accounting paints a totally different picture, showing that this company is actually performing a lot better than what the market thinks.

In reality, King Slide has been doing very well in the past 16 years, with Uniform ROAs that are 2x to 4x stronger than as-reported metrics show. These figures indicate that the company has benefited from its long-established diversification management strategy.
What as-reported metrics fail to do is to consider the company’s excess cash on the balance sheet. While most companies inherently need some level of cash to operate, the portion of that balance that is earning limited or no return—or excess cash—ends up diluting as-reported ROAs.
When excess cash remains included in the company’s asset base in computing its performance metrics, the company’s profitability and capital efficiency may appear weaker than it actually is. Removing excess cash allows investors to see through the distortions that come from management carrying much more cash on the balance sheet than what is operationally required.
From 2004 to 2019, King Slide has had a significant amount of excess cash sitting idly in its balance sheet, ranging from 28% to 69% of its as-reported total assets.
After excess cash and other significant adjustments are made, King Slide’s success in its diversification management strategy is justified by its Uniform ROAs, which are far more robust than its as-reported returns.
King Slide Works Co., Ltd.’s Uniform valuation is cheaper than you think

King Slide Works Co., Ltd. (2059:TAI) currently trades below corporate and historical averages with a 15x Uniform P/E (blue bars), which is also below its as-reported P/E of 17.6x (orange bars).
At these levels, the market is pricing in expectations for Uniform ROA to decrease from 30% in 2019 to 16% in 2024, accompanied by an 8% Uniform asset growth going forward.
However, analysts have less bearish expectations, projecting Uniform ROA to only decrease to 25% in 2021, accompanied by a 14% Uniform asset growth.
King Slide Works Co., Ltd.’s profitability is much better than you think it is

As-reported metrics are distorting the market’s perception of the firm’s profitability.
If you were to just look at as-reported ROA, you would think that the company is a weaker business than real economic metrics highlight.
King Slide’s Uniform ROA has been higher than its as-reported ROA in the past sixteen years. For example, when Uniform ROA peaked at 59% in 2015, as-reported ROA was only 14%.
Since 2004, the company’s Uniform ROA has been around or more than double as-reported ROA. From 46% in 2005, Uniform ROA decreased to 27% in 2009 before reaching a peak of 59% in 2015. Then, Uniform ROA fell to 22% in 2017 before increasing to 30% in 2019.
King Slide Works Co., Ltd.’s Uniform asset turns are more robust than you think
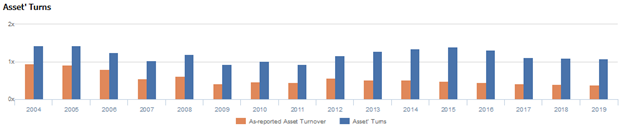
Volatility in Uniform ROA has been driven by trends in Uniform asset turns.
Uniform turns decreased from 1.4x levels in 2004-2005 to 0.9x-1.0x levels in 2007-2011, excluding a 1.2x outperformance in 2008. It then went back to peak 1.4x levels in 2014-2015 before fading to 1.1x levels in 2017-2019.
SUMMARY and King Slide Works Co., Ltd. Limited Tearsheet
As the Uniform Accounting tearsheet for King Slide Works Co., Ltd. (2059:TAI) highlights, its Uniform P/E trades at 15x, which is below global corporate average valuation levels and its own recent history.
Low P/Es require low EPS growth to sustain them. In the case of King Slide, the company has recently shown a 17% Uniform EPS contraction.
Sell-side analysts provide stock and valuation recommendations that in general provide very poor guidance or insight. However, sell-side analysts’ near-term earnings forecasts tend to have relevant information.
We take sell-side forecasts for Taiwan Financial Supervisory Commission: International Financial Reporting Standards (TIFRS) earnings and convert them to Uniform earnings forecasts. When we do this, King Slide’s sell-side analyst-driven forecast is a 13% earnings shrinkage in 2020 and a 24% earnings growth in 2021.
Based on the current stock market valuations, we can use earnings growth valuation metrics to back into the required growth rate to justify King Slide’s TWD 300 stock price. These are often referred to as market embedded expectations.
King Slide can have a 6% Uniform earnings shrinkage each year over the next three years and still justify current market expectations. What sell-side analysts expect for King Slide’s earnings is below what the current stock market valuation requires in 2020, but above this requirement in 2021.
The company’s earning power is 5x the corporate average. Additionally, cash flows and cash on hand are 7x its total obligations. Together, this signals a low credit and dividend risk.
To conclude, King Slide’s Uniform earnings growth is below its peer averages in 2020. However, the company is trading above its peer valuations.
About the Philippine Market Daily
“Wednesday Uniform Earnings Tearsheets – Asia-listed Focus”
Some of the world’s greatest investors learned from the Father of Value Investing or have learned to follow his investment philosophy very closely. That pioneer of value investing is Professor Benjamin Graham. His followers:
Warren Buffett and Charles Munger of Berkshire Hathaway; Shelby C. Davis of Davis Funds; Marty Whitman of Third Avenue Value Fund; Jean-Marie Eveillard of First Eagle; Mitch Julis of Canyon Capital; just to name a few.
Each of these great investors studied security analysis and valuation, applying this methodology to manage their multi-billion dollar portfolios. They did this without relying on as-reported numbers.
Uniform Adjusted Financial Reporting Standards (UAFRS or Uniform Accounting) is an answer to the many inconsistencies present in GAAP and IFRS, as well as in PFRS.
Under UAFRS, each company’s financial statements are rebuilt under a consistent set of rules, resulting in an apples-to-apples comparison. Resulting UAFRS-based earnings, assets, debts, cash flows from operations, investing, and financing, and other key elements become the basis for more reliable financial statement analysis.
Every Wednesday, we focus on one company listed in Asia that’s relevant to the Philippines and that’s particularly interesting from a UAFRS vs as-reported standpoint. We highlight one adjustment that illustrates why the as-reported numbers are unreliable.
This way, we gain a better understanding of the factors driving a particular stock’s returns, and whether or not the firm’s true profitability is reflected in its current valuations.
Hope you’ve found this week’s Uniform Earning Tearsheet on an Asian company interesting and insightful.
Stay tuned for next week’s Asia company highlight!
Regards,
Angelica Lim
Research Director
Philippine Markets Daily
Powered by Valens Research
www.valens-research.com


