
Uniform ROAs reaching as high as 65% shows how this school bus manufacturer successfully profits in a niche industry

The school bus industry is a niche, yet lucrative market. School buses are a necessary form of public transportation that carries millions of children to schools across the U.S. every day, so the demand is there.
That said, this school bus manufacturer doesn’t seem to be benefiting that much from the demand, with as-reported return on assets that are only around or below its cost of capital. However, Uniform Accounting reveals the opposite, with the company actually earning Uniform returns that are 6x higher.
Also below, Uniform Accounting Embedded Expectations Analysis and the Uniform Accounting Performance and Valuation Tearsheet for the company.
Philippine Markets Daily:
Thursday Uniform Earnings Tearsheets – Global Focus
Powered by Valens Research
In terms of public transportation in the U.S., the iconic yellow school bus is the figurative King of the Hill.
With a fleet of about 480,000, the number of school buses is two and a half times larger than the total number of vehicles for all other types of public transportation combined.
The entire fleet transports around 26 million schoolchildren, saving families over $7 billion in fuel costs and 2 billion gallons of fuel annually.
Not only is it more cost efficient for families, but research concludes that it is much safer for children to ride the school bus compared to having the parents drive their kids to school themselves.
Plus, one school bus is equivalent to about 36 cars on the road, which means that there’s much less traffic than there would have been if school buses didn’t exist.
Overall, it’s great for parents and their kids—there’s less risk, less expenses, and less traffic.
It’s even greater for the school bus manufacturers who can capitalize off this demand, such as Blue Bird Corporation (BLBD), one of the top school bus manufacturers in the U.S.
The company earned its title as one of the leading school bus manufacturers through its focus on safety and strong alternative fuel offerings.
In fact, Blue Bird is the only manufacturer with parts that are specifically designed for school bus uses and the only school bus company to be compliant with industry recognized safety tests such as Altoona Testing, Colorado Rack Test, and the Kentucky Pole Test.
Furthermore, Blue Bird is the market leader in electric, propane, gasoline, and compressed natural gas (CNG) fuel-powered buses. The company has consistently led the school bus industry when it comes to alternative-fuel powered buses, selling approximately eight times more than their competitors over the last decade.
It was the first to introduce the Type D CNG school bus, OEM-manufactured propane bus, and the Electronic Stability Control feature (which are automatic brakes that prevent the bus from spinning out).
It was also the first company to launch the first gasoline-powered Type C bus in partnership with Ford and Roush CleanTech, a leader in alternative fuel technology.
As a whole, Blue Bird’s bus fleet makes it much safer for the children and the environment, and it’s more cost efficient for the company as well.
However, Blue Bird only sells one product, and a niche product at that, compared to other larger markets. Furthermore, demand for school buses are heavily dependent on macro factors such as government funding, school activity levels, and the school bus replacement cycle, which is about 10-15 years.
For these reasons, returns for the company may be limited.
Blue Bird’s as-reported return on assets (ROAs) that are around or below cost-of-capital levels confirm this thesis.

However, Uniform ROAs that have ranged from 20%-65% show that Blue Bird is much more than just a boring school bus manufacturer. While it does sell a single, niche product, the company does this well enough to earn itself stellar returns.

The distortion between Uniform and as-reported ROAs comes from as-reported metrics failing to consider the amount of goodwill and intangible assets on Blue Bird’s balance sheet.
In recent years, goodwill and other intangibles sits at about $70 million, which is about one-fourth of the company’s long-term assets, arising from acquisitions made to expand their dealer network.
Goodwill and intangibles are purely accounting-based and unrepresentative of the company’s actual operating performance. When as-reported accounting includes this in a company’s balance sheet, it creates an artificially inflated asset base.
As a result, as-reported ROAs are not capturing the strength of Bluebird’s earning power. Adjusting for goodwill, we can see that the company isn’t just a limited-growth business. In fact, it has been the opposite, with the company earning returns that have been 4x-6x greater.
Blue Bird is actually more profitable than you think it is

As-reported metrics distort the market’s perception of the firm’s recent profitability. If you were to just look at as-reported ROA, you would think the company is a much weaker business than real economic metrics highlight.
Blue Bird’s Uniform ROA has actually been higher than its as-reported ROA in the past nine years. For example, Uniform ROA was at 20% in 2020, while as-reported ROA was only at 5%.
Specifically, Blue Bird’s Uniform ROA has ranged from 20%-65% in the past eight years while as-reported ROA has ranged from only 5%-12% levels in the same time frame.
Historically, Blue Bird has seen robust, volatile profitability, with Uniform ROA expanding from 29% in 2012 to a high of 65% in 2015, before fading to 20% in 2020.
Blue Bird’s Uniform earnings margin is weaker than you think, but its Uniform asset turns make up for it
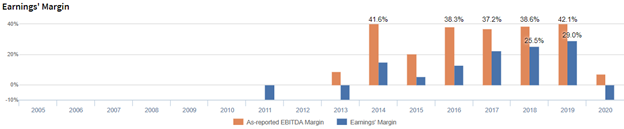
Declines in Uniform ROA have been driven by compounding trends in Uniform asset turns and Uniform earnings margin.
After improving from 3% in 2012 to 6% in 2013, Uniform margins fell to 3% in 2014 before recovering back to 6% levels through 2019, excluding a 4% outlier shrinkage in 2016. Uniform margins have then compressed to 4% in 2020.
Meanwhile, Uniform turns fell from 9.6x in 2012 to 8.9x in 2013, before expanding to a peak of 11.5x in 2015. However, since then, Uniform turns have weakened, fading to 4.7x in 2020.
At current valuations, the market is pricing in expectations for both Uniform margins and Uniform turns to remain stable.
SUMMARY and Blue Bird Corporation Tearsheet
As the Uniform Accounting tearsheet for Blue Bird Corporation (BLBD:USA) highlights, the Uniform P/E trades at 20.0x, which is below the global corporate average of 23.7x, but above its historical Uniform P/E of 17.3x.
Low P/Es require low EPS growth to sustain them. In the case of Blue Bird, the company has recently shown a 45% Uniform EPS decline.
Wall Street analysts provide stock and valuation recommendations that provide very poor guidance or insight in general. However, Wall Street analysts’ near-term earnings forecasts tend to have relevant information.
We take Wall Street forecasts for GAAP earnings and convert them to Uniform earnings forecasts. When we do this, Blue Bird’s Wall Street analyst-driven forecast is a 4% and 68% EPS growth in 2021 and 2022, respectively.
Based on current stock market valuations, we can use earnings growth valuation metrics to back into the required growth rate to justify Blue Bird’s $26 stock price. These are often referred to as market embedded expectations.
The company is currently being valued as if Uniform earnings were to grow by 5% annually over the next three years. What Wall Street analysts expect for Blue Bird’s earnings growth is below what the current stock market valuation requires in 2021 but above its requirement in 2022.
Furthermore, the company’s earning power is 3x the corporate average. However, cash flows and cash on hand are below its total obligations—including debt maturities and capex maintenance. Also, Blue Bird has a significant debt headwall in 2023. Overall, this signals a high credit risk.
To conclude, Blue Bird’s Uniform earnings growth is above its peer averages, and the company is trading in line with average peer valuations.
About the Philippine Market Daily
“Thursday Uniform Earnings Tearsheets – Global Focus”
Some of the world’s greatest investors learned from the Father of Value Investing or have learned to follow his investment philosophy very closely. That pioneer of value investing is Professor Benjamin Graham. His followers:
Warren Buffett and Charles Munger of Berkshire Hathaway; Shelby C. Davis of Davis Funds; Marty Whitman of Third Avenue Value Fund; Jean-Marie Eveillard of First Eagle; Mitch Julis of Canyon Capital; just to name a few.
Each of these great investors studied security analysis and valuation, applying this methodology to manage their multi-billion dollar portfolios. They did this without relying on as-reported numbers.
Uniform Adjusted Financial Reporting Standards (UAFRS or Uniform Accounting) is an answer to the many inconsistencies present in GAAP and IFRS, as well as in PFRS.
Under UAFRS, each company’s financial statements are rebuilt under a consistent set of rules, resulting in an apples-to-apples comparison. Resulting UAFRS-based earnings, assets, debts, cash flows from operations, investing, and financing, and other key elements become the basis for more reliable financial statement analysis.
Every Thursday, we focus on one multinational company that’s particularly interesting from a UAFRS vs as-reported standpoint. We highlight one adjustment that illustrates why the as-reported numbers are unreliable.
This way, we gain a better understanding of the factors driving a particular stock’s returns, and whether or not the firm’s true profitability is reflected in its current valuations.
Hope you’ve found this week’s Uniform earnings tearsheet on a multinational company interesting and insightful.
Stay tuned for next week’s multinational company highlight!
Regards,
Angelica Lim
Research Director
Philippine Markets Daily
Powered by Valens Research
www.valens-research.com


