
When this toy’s popularity popped, so did this company’s earnings, producing 19% Uniform ROAs, 60% more than you might think

New trends and changes in consumer behavior can kill or revive an industry—that is the life cycle of trade. For the toy manufacturing industry, changes in consumer trends occurred from the rise of the internet and video games.
This toy manufacturer has been cashing in on the success of its biggest client who’s taking advantage of the people’s love for pop culture.
However, as-reported metrics do not translate this to the company’s profitability. Uniform Accounting shows that the company’s Uniform return on assets (ROA) is stronger than what the market thinks.
Also below, Uniform Accounting Embedded Expectations Analysis and the Uniform Accounting Performance and Valuation Tearsheet for the company.
Philippine Markets Daily:
Wednesday Uniform Earnings Tearsheets – Asia-listed Focus
Powered by Valens Research
Culture is one of the main drivers of consumer behavior. The established norms and values in a society greatly impact people’s decisions, such as what things they should buy or consume in the market.
Popular culture, better known as “pop culture,” is generally a set of things, practices, or beliefs that is relevant in a period of time. Simply put, pop culture is anything that is the fad or mainstream at a time. The most common pop culture categories would be movies, fashion, TV, music, and technology.
One industry that uses pop culture to its advantage is the toy industry. Action figures, dolls, and plush toys are manufactured based on popular characters from video games, movies, or cartoons.
Funko, Inc. understands this market well.
Funko Pops started out as nostalgia-themed bobbleheads, as gifts and collectibles for pop culture fans. These vinyl toys have been around in one form or another for over two decades, but it was only in the last decade that the Pop! Vinyl’s, as they are known today, gained popularity.
Funko’s list of licenses extends beyond big names like Disney, Star Wars, Marvel, and DC Comics. There are also Pops! of athletes and comedians, and you can even create your own Pop!elganger (your own oversized head vinyl figure).
These vinyl toys are only one part of collectibles that have gained traction in the past few years. According to the market research company, NPD Group, global sales for collectibles rose by 26% in 2018, and comprised 11% of dollar sales in all of the toy industry.
The rise in demand for collectibles has contributed to Funko Inc.’s strong revenue, which steadily grew from USD 427 million in 2016 to USD 795 million in 2019.
Funko’s success has benefited other companies as well, particularly the manufacturer of these toys. Funko’s continuous strong performance and ability to expand its portfolio of licenses, growing its sales network and product categories, is one main growth factor for Dream International.
Dream International Limited manufactures a wide range of toys on an original equipment manufacturing (OEM) and original design manufacturing (ODM) basis.
The firm places importance to the relationship between the quality of its products in relation to its cost efficiency. As a result, apart from Funko Inc., the company was able to obtain giants as its customers, including Warner Bros., Bandai Namco, Costco Wholesale Corporation, Walt Disney, and Hasbro.
However, even with Dream International’s strong line of clients with promising growth opportunities, its as-reported returns appear weak, currently sitting at just 12% in 2019.
This is not an accurate representation of Dream International’s profitability. Its true profitability has the same trend as its as-reported figures show, but at a much higher level.
What as-reported metrics fail to do is to consider the company’s excess cash on the balance sheet. While most companies inherently need some level of cash to operate, the portion of that balance that is earning limited or no return—or excess cash—ends up diluting as-reported ROAs.
If excess cash remains included in the company’s asset base in computing its performance metrics, the company’s profitability and capital efficiency may appear weaker than it actually is.
From 2008 to 2019, Dream International has had a significant amount of excess cash sitting idly in its balance sheet, ranging from 9% to 35% of its as-reported total assets.
After excess cash and other significant adjustments are made, Dream International’s Uniform ROA is at 19% in 2019, which is 58% higher than its as-reported ROA of 12%.
Dream International Ltd. is cheaper than you think
Dream International currently trades at a 4.6x Uniform P/E (blue bars), which is cheaper than the as-reported P/E of 5.7x, and is way below market averages.
At these levels, the market is pricing in expectations for Uniform ROA to drop to 3% in 2024, accompanied by 12% Uniform asset growth.
However, analysts have less bearish expectations, projecting Uniform ROA to only compress to 15% in 2021, with a 4% Uniform asset growth.
Dream International Ltd. is more profitable than you think it is

As-reported metrics are distorting the market’s perception of the firm’s profitability.
If you were to just look at as-reported ROA, you would think that the company is a weaker business than real economic metrics highlight.
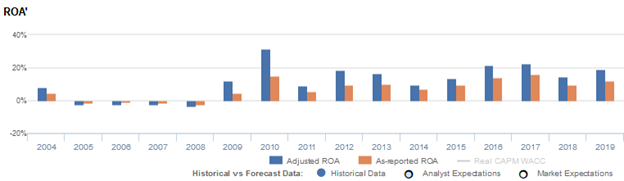
Dream International’s Uniform ROA has actually been higher than its as-reported ROA in the past eleven years. For example, as-reported ROA was 12% in 2019, which is lower than its Uniform ROA of 19%. When Uniform ROA peaked at 32% in 2010, as-reported ROA was just at 15%.
The company’s Uniform ROA for the past eleven years has ranged from 9% to 32%, while as-reported ROA has ranged only from 5% to 16% in the same timeframe.
From 8% in 2004, Uniform ROA gradually fell to -4% in 2008, before peaking to 32% in 2010. It then declined to 9% in 2011, before trending back to 23% in 2017. Since then, Uniform ROA has declined to 19% in 2019.
Dream International Ltd. has weaker Uniform earnings margins than you think, but its robust Uniform asset turns make up for it

Movement in Uniform ROA has been driven by trends in Uniform earnings margins, and to a lesser extent, by Uniform asset turns, with peaks and troughs lining up with that of Uniform ROA.
From 4% in 2004, Uniform earnings margins gradually declined to -2% in 2008, before rebounding to 12% in 2010. It then fell to 6% in 2011, before peaking to 13% in 2017. Since then, Uniform earnings margins have subsided to 12% in 2019.
Meanwhile, Uniform asset turns fell from 2.4x in 2004 to 1.4x in 2007, before reaching its all-time high of 2.6x in 2010. It then declined to 1.5x in 2011, recovered to 2.1x in 2012, before slowing down to 1.7x in 2019.
SUMMARY and Dream International Limited Tearsheet
As the Uniform Accounting tearsheet for Dream International Limited (1126:HKG) highlights, the Uniform P/E trades at 4.6x, which is below the corporate average valuation levels and its own recent history.
Low P/Es require low EPS growth to sustain them. In the case of Dream International, the company has recently shown a 35% Uniform EPS growth.
Sell-side analysts provide stock and valuation recommendations that in general provide very poor guidance or insight. However, sell-side analysts’ near-term earnings forecasts tend to have relevant information.
We take sell-side forecasts for Hong Kong Accounting Standards (HKAS) earnings and convert them to Uniform earnings forecasts. When we do this, Dream International’s sell-side analyst-driven forecast is an 8% earnings shrinkage in 2020, followed by immaterial shrinkage in 2021.
Based on current stock market valuations, we can use earnings growth valuation metrics to back into the required growth rate to justify Dream International’s HKD 3.45 stock price. These are often referred to as market embedded expectations.
Dream International can have Uniform earnings shrink by 28% in the next three years and still justify current prices. What sell-side analysts expect for Dream International’s earnings is above what the current stock market valuation requires in 2020 and 2021.
The company’s earning power is 3x the corporate average. Also, cash flows are more than 3x higher than its total obligations—including debt maturities, capex maintenance, and dividends. Together, this signals low credit and dividend risk.
To conclude, Dream International’s Uniform earnings growth is in line with its peer averages in 2020. Additionally, the company is trading below its peer valuations.
About the Philippine Market Daily
“Wednesday Uniform Earnings Tearsheets – Asia-listed Focus”
Some of the world’s greatest investors learned from the Father of Value Investing or have learned to follow his investment philosophy very closely. That pioneer of value investing is Professor Benjamin Graham. His followers:
Warren Buffett and Charles Munger of Berkshire Hathaway; Shelby C. Davis of Davis Funds; Marty Whitman of Third Avenue Value Fund; Jean-Marie Eveillard of First Eagle; Mitch Julis of Canyon Capital; just to name a few.
Each of these great investors studied security analysis and valuation, applying this methodology to manage their multi-billion dollar portfolios. They did this without relying on as-reported numbers.
Uniform Adjusted Financial Reporting Standards (UAFRS or Uniform Accounting) is an answer to the many inconsistencies present in GAAP and IFRS, as well as in PFRS.
Under UAFRS, each company’s financial statements are rebuilt under a consistent set of rules, resulting in an apples-to-apples comparison. Resulting UAFRS-based earnings, assets, debts, cash flows from operations, investing, and financing, and other key elements become the basis for more reliable financial statement analysis.
Every Wednesday, we focus on one company listed in Asia that’s relevant to the Philippines and that’s particularly interesting from a UAFRS vs as-reported standpoint. We highlight one adjustment that illustrates why the as-reported numbers are unreliable.
This way, we gain a better understanding of the factors driving a particular stock’s returns, and whether or not the firm’s true profitability is reflected in its current valuations.
Hope you’ve found this week’s Uniform Earning Tearsheet on an Asian company interesting and insightful.
Stay tuned for next week’s Asia company highlight!
Regards,
Angelica Lim
Research Director
Philippine Markets Daily
Powered by Valens Research
www.valens-research.com


