
With its design and sustainability efforts, this Korean car maker is benefitting from the EV industry with returns of 7%, not 2%

A boom in the EV industry means golden opportunities for one of Korea’s leading manufacturing automobile companies. Starting from humble beginnings and previously known for its bland style, this company later developed into a globally acknowledged automobile company through its focus on design, value, and sustainability.
However, as-reported metrics do not seem to reflect the impact of these efforts. Uniform Accounting shows that the business has a better Uniform return on assets (ROA) than what you might think.
Also below, Uniform Accounting Embedded Expectations Analysis and the Uniform Accounting Performance and Valuation Tearsheet for the company.
Philippine Markets Daily:
Wednesday Uniform Earnings Tearsheets – Asia-listed Focus
Powered by Valens Research
The automotive industry is one of the world’s largest industries in terms of revenue. Given the fast evolution of technology, automobiles have changed a lot compared to a century ago—and even in just the last decade.
From the brass era when “horseless carriages” were mostly powered by steam, to the 1908 Model T car, modern day cars have significantly improved in terms of form and technology.
Today, trends in digitization, technology, and sustainability have led to the rise of the electronic vehicle (EV) market.
The EV market is currently experiencing a boom, with a global sales increase of 41% in 2020. Moreover, it is expected that the number of registered EVs will increase from around 10 million today to approximately 145 million in 2030.
One company that will likely benefit from this trend is Kia Corporation.
Founded in 1944, Kia is known as the oldest vehicle manufacturer in Korea. It started off as a company manufacturing bicycles and motorcycles and then later evolved to become an automobile manufacturer.
Prior to 2009, Kia models were mostly known for their reliability and safety along with their budget-friendliness. However, its car designs were considered dull compared to other industry leaders, and that seeming unattractiveness led to lackluster results for the company.
The introduction of Kia Soul in 2009 marked a significant change in the car maker’s growth. The model’s distinctive box car design quickly became popular among the younger population, striking a balance between style, safety, and price. In its first year, it sold more than 31,000 units, beating the likes of Nissan and Honda in the small car market.
Since then, the Soul remains popular since the company is still continuously improving on the line while also introducing new iterations. The car line actually hit its 1 million units sold mark in 2018.
This focus on design also continued for Kia’s other lines such as Sorento, Sportage, and Cerato, which are now notable players in the mid-sized SUV segment.
Kia also puts significant efforts into its sustainability goals.
After it first entered the EV market in 2011 with the Kia Ray EV, the company launched several other battery EV and hybrid car models, focusing on zero-emission.
In 2020, Kia had the fourth largest market share in the segment together with Hyundai at 7%.
In order to further enhance its EV market leadership, Kia announced the Plan S strategy, which outlines its goal to transition from its current gas engine-centric business model to an EV-centric one. This plan aims to produce 11 EV lines by 2025 and 1 million eco-friendly units sold by 2026.
Looking at Kia’s design strategy and sustainability initiatives, one would assume that it would be reaping robust returns.
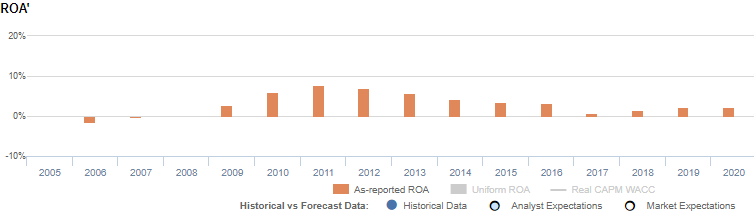
However, as-reported metrics show that the company’s performance in recent years has been weak, showing ROAs of just 1% to 8% in the past twelve years.
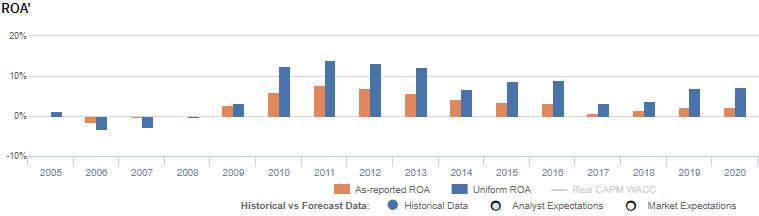
With Uniform Accounting, a different perspective is revealed. Specifically, the company’s Uniform returns are actually significantly higher than its as-reported metrics in the past twelve years, highlighting the momentum Soul had driven since its launch. In 2011, while as-reported ROA was only at 8%, Uniform ROA was actually 14%.
The distortion between Uniform and as-reported ROAs comes from as-reported metrics failing to consider the amount of non-operating long-term investments on Kia’s balance sheet.
These long-term investments are intangible assets that are purely accounting-based and unrepresentative of the company’s actual operating performance. When as-reported accounting includes this in a company’s balance sheet, it creates an artificially inflated asset base.
As a result, as-reported ROAs are not capturing the strength of Kia’s earning power. Adjusting for non-operating long-term investments, we can see that the company isn’t actually displaying weak performance. In fact, it is the opposite, with returns that are 4x greater.
Kia Corporation’s profitability is much more robust than you think

As-reported metrics are distorting the market’s perception of the firm’s profitability. If you were to just look at as-reported ROA, you would think that the company is a weaker business than real economic metrics reveal.
Kia Corporation’s Uniform ROA has been higher than its as-reported ROA for the past twelve years. For example, when Uniform ROA was at 7% in 2020, as-reported ROA was only 2%.
The company’s Uniform ROA for the past twelve years has ranged from 3% to 14%, while as-reported ROA has ranged only from 1% to 8% in the same timeframe.
Specifically, Uniform ROA recovered from negative levels in 2006 to a 14% peak in 2011, before falling to 3% in 2017. It then rebounded to 7% levels in 2020.
Kia Corporation’s Uniform earnings margins are weaker than you think but its robust Uniform asset turns make up for it
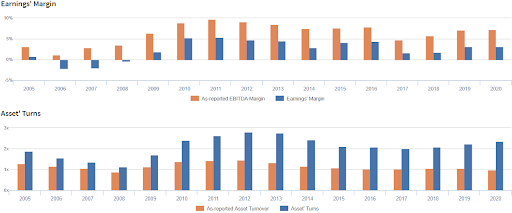
Volatility in Uniform ROA has been driven by trends in Uniform earnings margin, and to a lesser extent by Uniform asset turns, with peaks and troughs lining up historically with that of Uniform ROA.
From 1% levels in 2005, Uniform margins fell to negative levels from 2006-2008 before peaking at 5% in 2011. Then, Uniform margins fell to 2% in 2017, before recovering to 3% in 2020.
Meanwhile, Uniform turns fell from 1.9x in 2005 to 1.1x in 2008, before peaking at 2.8x levels in 2012-2013. It then stabilized to 2.0x-2.3x levels from 2015 onwards.
SUMMARY and Kia Corporation Tearsheet
As our Uniform Accounting tearsheet for Kia Corporation (000270:KOR) highlights, the Uniform P/E trades at 3.9x, which is below the global corporate average of 23.7x but around its own historical average of 3.1x.
Low P/Es require low EPS growth to sustain them. In the case of Kia, the company has recently shown an immaterial Uniform EPS growth.
Sell-side analysts provide stock and valuation recommendations that in general provide very poor guidance or insight. However, sell-side analysts’ near-term earnings forecasts tend to have relevant information.
We take sell-side forecasts for Korean International Financial Reporting Standards (K-IFRS) earnings and convert them to Uniform earnings forecasts. When we do this, Kia Corporation’s sell-side analyst-driven forecast is a 174% and 7% EPS growth in 2021 and 2022, respectively.
Based on the current stock market valuations, we can use earnings growth valuation metrics to back into the required growth rate to justify Kia Corporation’s KRW 86,000.00 stock price. These are often referred to as market embedded expectations.
Kia is currently being valued as if Uniform earnings were to shrink 14% annually over the next three years. What sell-side analysts expect for Kia Corporation’s earnings growth is above what the current stock market valuation requires in 2021 and 2022.
Furthermore, the company’s earning power is in line with the long-run corporate average. Also, cash flows and cash on hand are around 8x its total obligations—including debt maturities, capex maintenance, and dividends. All in all, this signals a low credit and dividend risk.
To conclude, Kia Corporation’s Uniform earnings growth is above its peer averages. However, the company is trading below its average peer valuations.
About the Philippine Markets Daily
“Wednesday Uniform Earnings Tearsheets – Asia-listed Focus”
Some of the world’s greatest investors learned from the Father of Value Investing or have learned to follow his investment philosophy very closely. That pioneer of value investing is Professor Benjamin Graham. His followers:
Warren Buffett and Charles Munger of Berkshire Hathaway; Shelby C. Davis of Davis Funds; Marty Whitman of Third Avenue Value Fund; Jean-Marie Eveillard of First Eagle; Mitch Julis of Canyon Capital; just to name a few.
Each of these great investors studied security analysis and valuation, applying this methodology to manage their multi-billion dollar portfolios. They did this without relying on as-reported numbers.
Uniform Adjusted Financial Reporting Standards (UAFRS or Uniform Accounting) is an answer to the many inconsistencies present in GAAP and IFRS, as well as in PFRS.
Under UAFRS, each company’s financial statements are rebuilt under a consistent set of rules, resulting in an apples-to-apples comparison. Resulting UAFRS-based earnings, assets, debts, cash flows from operations, investing, and financing, and other key elements become the basis for more reliable financial statement analysis.
Every Wednesday, we focus on one company listed in Asia that’s relevant to the Philippines and that’s particularly interesting from a UAFRS vs as-reported standpoint. We highlight one adjustment that illustrates why the as-reported numbers are unreliable.
This way, we gain a better understanding of the factors driving a particular stock’s returns, and whether or not the firm’s true profitability is reflected in its current valuations.
Hope you’ve found this week’s Uniform Earning Tearsheet on an Asian company interesting and insightful.
Regards,
Angelica Lim
Research Director
Philippine Markets Daily
Powered by Valens Research
www.valens-research.com


