
Making its products all about “love” has driven this company’s Uniform ROAs to 10%, not below cost of capital!

Unique features like a boxer engine or the Symmetrical All Wheel Drive aren’t the only thing that makes this company popular. Making its cars all about love brought huge success to the company.
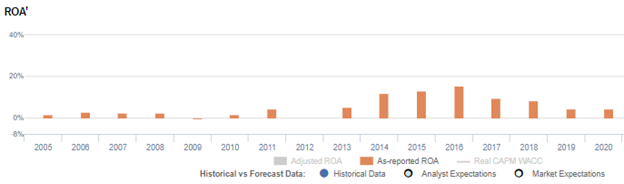
As-reported metrics suggest that this company’s innovations and strategies do not generate significant returns, with its return on assets (ROA) only at 4%. However, Uniform Accounting shows otherwise, with TRUE returns more than twice what is reported at 10%.
Also below, Uniform Accounting Embedded Expectations Analysis and the Uniform Accounting Performance and Valuation Tearsheet for the company.
Philippine Markets Daily:
Wednesday Uniform Earnings Tearsheets – Asia-listed Focus
Powered by Valens Research
In 1902, Komanosuke Uchiyama, an engineer at Tokyo Motor Vehicle Works, made the very first gas-powered car in Japan by using a gasoline engine that had been brought back from the United States. He also produced the first entirely Japanese-made car in 1907.
This was the beginning of Japan’s automobile industry.
In the mid to late 1910s, Japanese zaibatsu, or business conglomerates that had massive influences on Japanese domestic and foreign policies, began venturing into automobile manufacturing. The companies designed their own trucks or partnered with foreign brands to sell their cars in Japan under licenses.
The era of the powerful zaibatsu ended with the surrender of Japan in World War II. However, not all zaibatsu were dissolved as the Allied forces, specifically the U.S. government, saw the zaibatsu’s value in reindustrializing Japan. The re-formation of the zaibatsu included the restarting and the innovation of the Japanese car industry in the late 1950s. Car manufacturers in the country started to develop small and fuel-efficient cars with the support of the government.
From its humble beginnings, Japan’s automobile industry has become one of the most prominent and one of the biggest in the world. The country’s automakers continue to focus on innovation, particularly in manufacturing systems, management systems, and automotive materials, giving the Japanese brands their international competitive advantage.
One such automaker is a well-known brand that has withstood the test of time, despite one incredibly disastrous advertising campaign.
Subaru Corporation is engaged in both the aerospace and automobile industry, with more than 95% of its sales attributed to its automotive division. Previously known as Fuji Heavy Industries, the company officially changed its name to Subaru Corporation in 2017, just in time for the 100th anniversary of its founding business, the Nakajima Aircraft Company.
Nakajima Aircraft Company was established as an aircraft manufacturer for Japan during World War II. In 1953, it became known as Fuji Heavy Industries, and a year later, it entered the Japanese car manufacturing industry with Subaru.
In the late 1960s, Subaru finally entered the U.S. market when businessman Malcolm Bricklin decided to import the Subaru 360. Since the Japanese car weighed less than 1,000 pounds, it did not require federalizing, or the costly process of making sure the car meets or exceeds U.S. safety standards. So even if the Subaru 360 was not an attractive-looking car that was suited for the roads of America, Bricklin pushed forward with the importing.
The Subaru 360 entered the market with a rather bold advertisement. The company advertised the car as “cheap and ugly” to catch people’s attention by not sugarcoating the product. Although it was the first of its kind, built on ideas from aircraft manufacturing, consumers and analysts claimed that this car was anything but extraordinary.
The unpopularity of the car was evident in its sales numbers—only 6,000 sold over its 12-year run versus over 390,000 produced.
Today, the Subaru has evolved and moved past its rough start in the U.S., and is linked to more positive words such as reliable, safe, and family-friendly. It is also now more known for its “Love” campaign with the tagline, “Love. It’s what makes a Subaru a Subaru,” which was launched more than a decade ago.
The Love campaign put more emphasis on people’s experience with the car rather than just its specs. It wasn’t just about showcasing the technical aspects of the car—it was about tugging on the consumer’s emotional side.
Making Subaru all about love proved to be a huge success that the company decided to carry out more successful ad campaigns under the same theme, such as “Dear Subaru” and “Subaru Love Promise.”
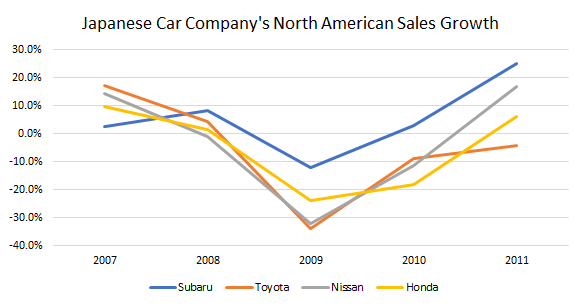
The effectiveness of this campaign is evident with Subaru’s North American sales increase of 8% in 2008, in comparison to its Japanese peers which had a slowdown in revenues. Moreover, this ad campaign helped mitigate the unfavorable impact of the global financial crisis in 2009, as many of the leading Japanese automobile manufacturers saw their North American sales decline by 20%-30%, while Subaru only declined by 11% during the year.
However, it appears that Subaru’s ad campaigns haven’t been converting the car brand’s popularity into sales, as its as-reported returns have been declining and is currently sitting below cost of capital at 4%.
Uniform Accounting tells us that this is a misleading representation of Subaru’s profitability. In fact, the company’s Uniform ROA is more robust than what the as-reported figures show.
What as-reported metrics fail to do is to consider the company’s excess cash on the balance sheet. While most companies inherently need some level of cash to operate, the portion of that balance that is earning limited or no return—or excess cash—ends up diluting as-reported ROAs.
When excess cash remains included in the company’s asset base in computing its performance metrics, the company’s profitability and capital efficiency may appear weaker than it actually is. Removing excess cash allows investors to see through the distortions that come from management carrying much more cash on the balance sheet than what is operationally required.
From 2011 to 2020, Subaru has had a significant amount of excess cash sitting idly in its balance sheet, ranging from 12% to 32% of its as-reported total assets.
After excess cash and other significant adjustments are made, Subaru’s Uniform ROA is at 10% in 2020, which is more than 2x higher than its as-reported ROA of 4%.
Subaru’s valuations are below corporate averages

Subaru Corporation (7270:JPN) currently trades below corporate averages at a 20.3x Uniform P/E (blue bars), but above its as-reported P/E of 10.7x (orange bars).
At these levels, the market is pricing in expectations for Uniform ROA to decline to 3% in 2025, accompanied by 4% Uniform asset growth going forward.
Analysts have less bearish expectations, projecting Uniform ROA to fade to 7% in 2022, accompanied by a 4% Uniform asset contraction.
Subaru’s profitability is much better than you think it is

As-reported metrics are distorting the market’s perception of the firm’s profitability.
If you were to just look at as-reported ROA, you would think that the company is a weaker business than real economic metrics highlight.
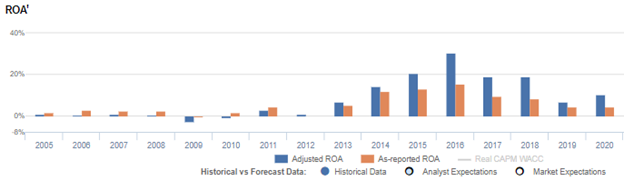
Subaru’s as-reported ROA has been lower than its Uniform ROA in the past nine years. For example, as-reported ROA is 4% in 2020, lower than its Uniform ROA of 10%. When Uniform ROA was at 31% in 2016, as-reported ROA was only roughly half that at 16%.
The company’s Uniform ROA for the past nine years has ranged from 1% to 31%, while as-reported ROA ranged only from immaterial levels to 16% in the same time frame.
From 1% in 2005, Uniform ROA fell to negative levels in 2009, before reaching a peak of 31% in 2016. Uniform ROA then gradually faded to 10% in 2020.
Subaru’s Uniform earnings margins are weaker than you think but its robust Uniform asset turns make up for it
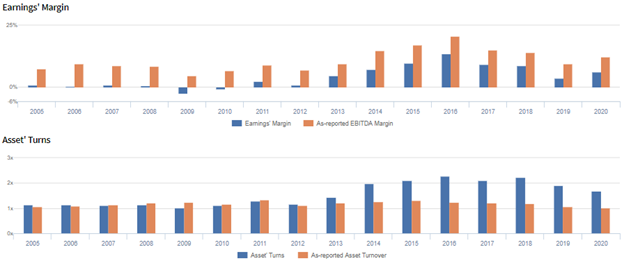
Volatility in Uniform ROA has been driven by trends in both Uniform earnings margins and Uniform asset turns, with peaks and troughs lining up historically with that of Uniform ROA.
From 1% in 2005, Uniform earnings margins declined to -3% in 2009, before peaking at 13% in 2016. It then gradually decreased to 6% in 2020.
Meanwhile, Uniform asset turns increased from 1.1x in 2005 to a peak of 2.3x in 2016, before falling to 1.7x in 2020.
SUMMARY and Subaru Corporation Tearsheet
As the Uniform Accounting tearsheet for Subaru Corporation (7270:JPN) highlights, its Uniform P/E trades at 20.3x, which is below corporate average valuation levels, but above its own recent history.
Low P/Es require low EPS growth to sustain them. In the case of Subaru, the company has recently shown a 79% Uniform EPS growth.
Sell-side analysts provide stock and valuation recommendations that in general provide very poor guidance or insight. However, sell-side analysts’ near-term earnings forecasts tend to have relevant information.
We take sell-side forecasts for Japan’s Modified International Standards (JMIS) earnings and convert them to Uniform earnings forecasts. When we do this, Subaru’s sell-side analyst-driven forecast is an 83% earnings shrinkage in 2021, followed by a 282% earnings growth in 2022.
Based on current stock market valuations, we can use earnings growth valuation metrics to back into the required growth rate to justify Subaru’s JPY 2,020.50 stock price. These are often referred to as market embedded expectations.
Subaru can have Uniform earnings shrink by 20% each year over the next three years and still justify current market expectations. What sell-side analysts expect for Subaru’s earnings is below what the current stock market valuation requires in 2021, but well above that requirement in 2022.
The company’s earning power is 2x higher than the corporate average. Additionally, cash flows and cash on hand are above its total obligations—including debt maturities, capex maintenance, and dividends. Together, this signals a low credit and dividend risk.
To conclude, Subaru’s Uniform earnings growth is in line with its peer averages in 2020. However, the company is trading above its peer valuations.
About the Philippine Markets Daily
“Wednesday Uniform Earnings Tearsheets – Asia-listed Focus”
Some of the world’s greatest investors learned from the Father of Value Investing or have learned to follow his investment philosophy very closely. That pioneer of value investing is Professor Benjamin Graham. His followers:
Warren Buffett and Charles Munger of Berkshire Hathaway; Shelby C. Davis of Davis Funds; Marty Whitman of Third Avenue Value Fund; Jean-Marie Eveillard of First Eagle; Mitch Julis of Canyon Capital; just to name a few.
Each of these great investors studied security analysis and valuation, applying this methodology to manage their multi-billion dollar portfolios. They did this without relying on as-reported numbers.
Uniform Adjusted Financial Reporting Standards (UAFRS or Uniform Accounting) is an answer to the many inconsistencies present in GAAP and IFRS, as well as in PFRS.
Under UAFRS, each company’s financial statements are rebuilt under a consistent set of rules, resulting in an apples-to-apples comparison. Resulting UAFRS-based earnings, assets, debts, cash flows from operations, investing, and financing, and other key elements become the basis for more reliable financial statement analysis.
Every Wednesday, we focus on one company listed in Asia that’s relevant to the Philippines and that’s particularly interesting from a UAFRS vs as-reported standpoint. We highlight one adjustment that illustrates why the as-reported numbers are unreliable.
This way, we gain a better understanding of the factors driving a particular stock’s returns, and whether or not the firm’s true profitability is reflected in its current valuations.
Hope you’ve found this week’s Uniform Earning Tearsheet on an Asian company interesting and insightful.
Stay tuned for next week’s Asia company highlight!
Regards,
Angelica Lim
Research Director
Philippine Markets Daily
Powered by Valens Research
www.valens-research.com


