
Uniform Accounting shows how this stockbroker is actually COLing more than 2x its ROA of 21%, not 4%

“The best chance to deploy capital is when things are going down”
In 2018, Warren Buffett had that to say about why strategic buybacks are better than recurring dividends. It’s also a pretty solid strategy of buying inexpensive stocks during market downtrends.
This led to an increase of online retail investors who wished to take advantage of this strategy, and this stockbroker was able to capitalize on this growth trend. Although as-reported metrics see an unprofitable situation, its Uniform ROA reveals otherwise.
Also below, Uniform Accounting Embedded Expectations Analysis and the Uniform Accounting Performance and Valuation Tearsheet for the company.
Philippine Markets Newsletter:
Wednesday Uniform Earnings Tearsheets – Philippine-listed Focus
Powered by Valens Research
At the beginning of the pandemic, investors’ initial reaction all over the world was to sell off their current positions out of fear of economies collapsing. With countries rushing to close their borders, various business activities came to a halt, triggering massive layoffs and expediting automation and work-from-home arrangements.
The Philippine stock market was no exception, seeing the Philippine Stock Exchange index (PSEi) crash by half from January 2020, to levels not seen since 2012.
With stock prices hitting new lows, many investors saw an opportunity to enter a market that had just a few days before been slightly expensive. This opportunity also attracted other novice investors and watchers to enter the market and take advantage of the cheaper rates.
Stockbrokers like the COL Financial Group, Inc. (COL:PHL) benefitted from the rapid growth of retail investor participation in 2020.
Established in 1999, Edward K. Lee founded the company as a means to develop an inexpensive and accessible way to invest in the PSE.
Then, the company continued to expand its operations to the Hong Kong stock market by creating a foreign subsidiary called COL Securities (HK) Limited or simply COLHK.
Furthermore, with the vision of providing its customers with global opportunities, COLHK clients can digitally access global stock markets such as Japan, the USA, Singapore, Germany, and China.
Although COLHK continues to have small contributions to COL Financial’s total revenue, its growth prospects remain positive as the average daily value turnover in the Hong Kong stock market improved by 48% in 2020.
Meanwhile, the average daily value turnover in the PSE was flat for the year, mainly offset due to the continuous decline in foreign investor participation since mid-2019.
Nevertheless, the PSE has a broad target market, and the total stock market accounts only consist of 1.3% of the Philippines’ population as of 2020. This gives the PSE and COL Financial a lot of room to grow going forward via retail investor participation.
As one of the largest online stockbrokers in the Philippines, COL Financial is positioned to capitalize on the retail investor participation growth as its number of customer accounts increased by 32% in 2020.
However, looking at the as-reported metrics, COL Financial has had returns below cost-of-capital levels, implying that the firm has generated little economic value for its stockholders since 2014.
In reality, COL Financial’s real economic profitability suggests that the firm has actually produced better profits since 2006 by almost double the as-reported ROA levels in some years.

One major contributing factor that has led to the misstatement of as-reported metrics is the failure to consider current liabilities in the profitability calculation.
Traditional ROA calculations for measuring a firm’s earning power only include current and long-term assets as part of the cost of investment.
However, a company’s ability to receive goods and services in advance of payments—the current liabilities—ought to be factored in as well.
Current liabilities (excluding short-term debt) are necessary for operations. Items such as accounts payable, accrued expenses, and others are used to maintain the firm’s current capital position. On the other hand, long-term liabilities are mostly just used to finance the business.
For COL Financial, the client’s cash balances are reflected in the company’s trade payables. If it has a large asset base to service its current liabilities, and we only factor in its assets, the company would look inefficient, especially with the increase in its customer accounts in 2020.
In reality, the company is just being responsible for maintaining its liquidity position to meet short-term obligations, particularly from customer withdrawals.
As such, net working capital (current assets – current liabilities) is used for the firm’s ROA calculation. This shows a company’s real cash management ability and thereby, its true earning power.
When current liabilities are subtracted from COL Financial’s assets, along with the many other necessary adjustments made, this leads to a 21% Uniform ROA in 2020.
COL Financial’s earning power is stronger than you think
As-reported metrics distort the market’s perception of the firm’s historical profitability. If you were to just look at as-reported ROA, you would think that the company is a much weaker business than real economic metrics highlight.
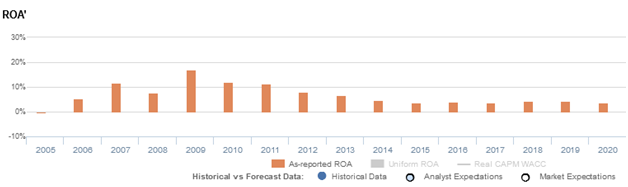
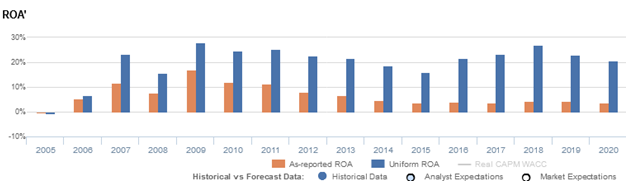
COL Financial’s Uniform ROA has actually been higher than its as-reported ROA since 2006, and exceeded 2x higher in the past decade. For example, as-reported ROA was 4% in 2020, significantly lower than Uniform ROA of 21%.
After peaking at 17% in 2009, as-reported ROA gradually declined to 4%-5% levels in 2014-2020. Meanwhile, Uniform ROA also reached a high of 28% in 2009. Thereafter, Uniform ROA slowly contracted to 16% in 2015, but rebounded to 27% in 2018, before fading to 21% in 2020.
COL Financial’s asset turns are more efficient than you think

Trends in Uniform ROA have been driven by trends in Uniform asset turns. Since 2006, as-reported metrics have significantly understated COL Financial’s asset utilization, a key driver of profitability.
As-reported asset turnover remained at 0.1x levels in 2005-2006, before rising to 0.2x peaks in 2007-2013 and fading back to 0.1x levels through 2020. Meanwhile, after improving from 0.1x in 2005 to 0.5x in 2007, Uniform asset turns further expanded to 0.6x highs in 2017-2018, before compressing to 0.5x levels through 2020.
As-reported metrics have been making COL Financial appear to be a less efficient business than real economic metrics highlight.
SUMMARY and COL Financial Group, Inc. Tearsheet
As our Uniform Accounting tearsheet for COL Financial Group, Inc. (COL:PHL) highlights, the company trades at a Uniform P/E of 31.2x, above the global corporate average of 24.3x, but below its historical P/E (excluding 2020) of 47.2x.
Moderate P/Es require moderate EPS growth to sustain them. In the case of COL Financial, the company has recently shown a 5% Uniform EPS shrinkage.
Sell-side analysts provide stock and valuation recommendations that in general provide very poor guidance or insight. However, sell-side analysts’ near-term earnings forecasts tend to have relevant information.
We take sell-side forecasts for Philippine Financial Reporting Standards (PFRS) earnings and convert them to Uniform earnings forecasts. When we do this, COL Financial’s sell-side analyst-driven forecast is to see Uniform earnings shrink by 21% and 1% by 2021 and 2022, respectively.
Based on current stock market valuations, we can use earnings growth valuation metrics to back into the required growth rate to justify COL Financial’s PHP 4.05 stock price. These are often referred to as market embedded expectations.
The company is currently being valued as if Uniform earnings were to grow 7% annually over the next three years. What sell-side analysts expect for COL Financial’s earnings growth is below what the current stock market valuation requires through 2022.
Furthermore, the company’s earning power is 3x above the long-run corporate average. Moreover, cash flows and cash on hand are 20x above total obligations—including debt maturities, capex maintenance, and dividends. Together, this signals a low dividend risk.
Lastly, COL Financial’s Uniform earnings growth is below its peer averages, but currently trades in line with its average peer valuations.
About the Philippine Markets Newsletter
“Wednesday Uniform Earnings Tearsheets – Philippine-listed Focus”
Some of the world’s greatest investors learned from the Father of Value Investing or have learned to follow his investment philosophy very closely. That pioneer of value investing is Professor Benjamin Graham. His followers:
Warren Buffett and Charles Munger of Berkshire Hathaway; Shelby C. Davis of Davis Funds; Marty Whitman of Third Avenue Value Fund; Jean-Marie Eveillard of First Eagle; Mitch Julis of Canyon Capital; just to name a few.
Each of these great investors studied security analysis and valuation, applying this methodology to manage their multi-billion dollar portfolios. They did this without relying on as-reported numbers.
Uniform Adjusted Financial Reporting Standards (UAFRS or Uniform Accounting) is an answer to the many inconsistencies present in GAAP and IFRS, as well as in PFRS.
Under IFRS, each company’s financial statements are rebuilt under a consistent set of rules, resulting in an apples-to-apples comparison. Resulting UAFRS-based earnings, assets, debts, cash flows from operations, investing, and financing, and other key elements become the basis for more reliable financial statement analysis.
Every Wednesday, we focus on one Philippine-listed company that’s particularly interesting from a UAFRS vs as-reported standpoint. We highlight one adjustment that illustrates why the as-reported numbers are unreliable.
This way, we gain a better understanding of the factors driving a particular stock’s returns, and whether or not the firm’s true profitability is reflected in its current valuations.
Hope you’ve found this week’s Uniform Earnings Tearsheet on a Philippine company interesting and insightful.
Stay tuned for next week’s Philippine company highlight!
Regards,
Angelica Lim
Research Director
Philippine Markets Newsletter
Powered by Valens Research
www.valens-research.com


