
Uniform ROAs of 30%+ signal that this broadcasting company is far from pulling the plug, even if it is operating in a dying industry

The cable TV industry has been in a secular decline over the past decade thanks to the booming popularity of video-on-demand platforms.
Due to these major industry headwinds, investors and analysts alike presume that cable and broadcasting companies only earn below average returns.
This broadcasting company, for example, has had historical as-reported returns that are below cost of capital. However, Uniform Accounting reveals returns that are actually 10x-15x greater owing to its strong business focus and strategies to relieve competitive pressures.
Also below, Uniform Accounting Embedded Expectations Analysis and the Uniform Accounting Performance and Valuation Tearsheet for the company.
Philippine Markets Daily:
Thursday Uniform Earnings Tearsheets – Global Focus
Powered by Valens Research
In the early 2000s, Netflix had only about 300,000 subscribers and was still struggling to compete with Blockbuster in the DVD rentals business.
Two decades later, Blockbuster is no more while Netflix has grown its subscriber base to 208 million—and counting.
Netflix’s growth story began when it switched its focus to video-on-demand (VOD) services, leading that market ever since. Plus, not only did the company beat out Blockbuster, it also started the trend of cord cutting.
Cord cutting is when people cancel their often-expensive cable TV subscriptions and switch to cheaper VOD subscriptions such as Netflix, Hulu, or Disney+.
Other than the cost, what’s driving the cord-cutting trend is that people, especially the younger generations, prefer to consume content the way they want it, when they want it. No one’s paying upwards of $50 for a few shows that can only be watched at a specific time once per day.
Streaming services like Netflix not only let its users watch their favorite shows anytime, but also allow users to personalize their show list. These apps can even suggest shows that are similar to the ones on the user’s list using AI.
There are about 31 million total cord-cutters in the U.S., and that number is expected to rise to more than 47 million over the next five years. While there are still about 78 million households subscribed to cable TV, that number has declined significantly from peak levels over five years ago.
It’s clear that streaming services have heavily disrupted the cable TV industry, similar to how Airbnb disrupted the vacation properties space. So what does this mean for broadcasting companies?
Let’s take a look at one of the top broadcasting networks in the U.S., Sinclair Broadcast Group (SBGI).
Sinclair operates as the largest media firm engaging in local news and sports broadcasting. It has 188 stations in 88 markets, broadcasting over 600 channels from top networks such as FOX, ABC, NBC, and CW.
Specifically, the company broadcasts about 2,500 hours of news per week and approximately 4,800 sports games, and produces roughly 24,800 hours of new content per year.
Sinclair is predominantly focused on its TV operations. However, to compete with streaming services, the company is offering its own streaming platform consisting of news and sports shows it has the rights to, as well as live broadcasts news and sports events.
That said, looking at as-reported metrics, Sinclair looks like a firm generating returns below the cost of capital, much like all TV broadcasting companies, thanks to major competitive headwinds.
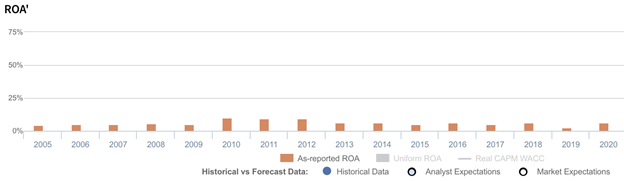
As-reported return on assets (ROAs) have ranged from 2%-7% over the past sixteen years, save for the period from 2010-2012 when it was earning 9%-10% returns.
In reality, under the lens of Uniform Accounting, profitability for Sinclair is a significantly different story.

While it is facing headwinds, the company is still a best-in-class operator and is consistently innovating on different ways to maintain and improve returns and growth—including launching its own streaming service. This has led to Uniform returns that have ranged from 17%-61% over the past sixteen years.
In 2020, when cord-cutting accelerated due to the pandemic, Sinclair was able to earn all-time high returns due to a surge in political revenues from election advertisements.
However, even without the elections, the company being able to earn historically high returns implies that people still prefer to watch the news and sports events on TV. This is especially the case if the shows are live, which makes Sinclair’s business focus a smart one.
Breaking down the technicalities, the distortion between Uniform and as-reported ROAs comes from as-reported metrics failing to consider the amount of goodwill and intangibles on Sinclair’s balance sheet. In recent years, this sits close to $7.5 billion, about half of its total assets, stemming from the company’s acquisitions of the broadcasting rights of its shows.
Goodwill and intangible assets are purely accounting-based and unrepresentative of the company’s actual operating performance. When as-reported accounting includes this in a company’s balance sheet, it creates an artificially inflated asset base.
As a result, as-reported ROAs are not capturing the strength of Sinclair’s earning power. Adjusting for goodwill and intangibles, we can see that returns aren’t actually weak. In fact, it has been the complete opposite, with returns that are 10x-15x greater.
Sinclair’s earning power is significantly more robust than you think it is
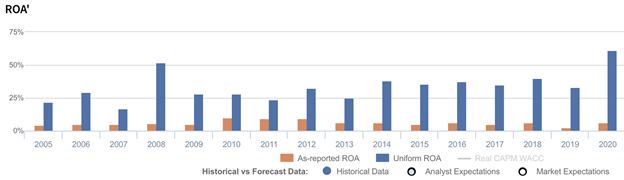
As-reported metrics distort the market’s perception of the firm’s recent profitability. If you were to just look at as-reported ROA, you would think the company is a much weaker business than real economic metrics highlight.
Sinclair’s Uniform ROA has actually been higher than its as-reported ROA in the past sixteen years. For example, Uniform ROA was at 61% in 2020 while as-reported ROA was at 6%.
Historically, Sinclair’s as-reported ROA has ranged from 2% to 10% in the past sixteen years while Uniform ROA has ranged from 17% to 61% in the same timeframe.
After improving from 22% in 2005 to 29% in 2006, Uniform ROA fell to 17% in 2007 before rebounding to 52% in 2008. Uniform ROA then declined to 28% levels in 2009-2010. Thereafter, Uniform ROA saw three subsequent years of volatility, ranging from 24%-33% from 2011-2013, before rising to 40% in 2018 and falling to 33% in 2019. Subsequently, Uniform ROA rebounded to a peak of 61%.
Sinclair’s Uniform earnings margin is weaker than you think, but its Uniform asset turns make up for it
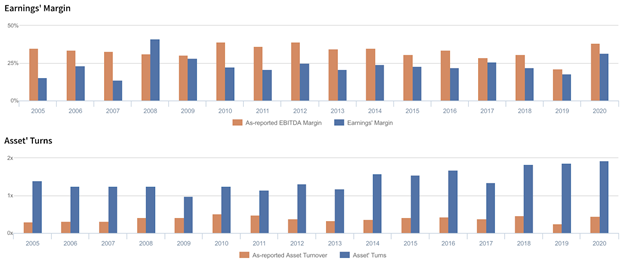
Overall improvements in profitability have been driven by trends in both Uniform earnings margin and Uniform asset turns.
After improving from 16% in 2005 to 23% in 2006, Uniform margins declined to 14% in 2007. Thereafter, Uniform margins jumped to a historical high of 41% in 2008, before fading to and stabilizing at 21%-28% levels through 2018. Uniform margins have since contracted to 18% in 2019, before rebounding to 32% in 2020.
Meanwhile, Uniform turns fell from 1.2x-1.4x levels in 2004-2008 to 1.0x in 2009, before slowly improving to a peak of 1.9x in 2020, excluding a 1.3x underperformance in 2017.
At current valuations, the market is pricing in expectations for both Uniform margins and Uniform turns to decline.
SUMMARY and Sinclair Broadcast Group, Inc. Tearsheet
As the Uniform Accounting tearsheet for Sinclair Broadcast Group, Inc. (SBGI:USA) highlights, the Uniform P/E trades at 13.3x, which is below the global corporate average of 23.7x, but above its own historical P/E of 11.0x.
Low P/Es require low, and even negative, EPS growth to sustain them. In the case of Sinclair, the company has recently shown a 427% Uniform EPS growth.
Wall Street analysts provide stock and valuation recommendations that in general provide very poor guidance or insight. However, Wall Street analysts’ near-term earnings forecasts tend to have relevant information.
We take Wall Street forecasts for GAAP earnings and convert them to Uniform earnings forecasts. When we do this, Sinclair’s Wall Street analyst-driven forecast is a 71% EPS decline and 80% EPS growth in 2021 and 2022, respectively.
Based on the current stock market valuations, we can use earnings growth valuation metrics to back into the required growth rate to justify Sinclair’s $27 stock price. These are often referred to as market embedded expectations.
The company is currently being valued as if Uniform earnings were to shrink by 15% annually over the next three years. What Wall Street analysts expect for Sinclair’s earnings growth is below what the current stock market valuation requires in 2021, but above that requirement in 2022.
Furthermore, the company’s earning power is 10x the long-run corporate average. Also, cash flows and cash on hand are above its total obligations—including debt maturities, capex maintenance, and dividend. However, intrinsic credit risk is 440bps above the risk-free rate. Together, this signals an average credit and dividend risk.
That said, Sinclair’s Uniform earnings growth is below its peer averages, and the company is trading below peer valuations.
About the Philippine Markets Daily
“Thursday Uniform Earnings Tearsheets – Global Focus”
Some of the world’s greatest investors learned from the Father of Value Investing or have learned to follow his investment philosophy very closely. That pioneer of value investing is Professor Benjamin Graham. His followers:
Warren Buffett and Charles Munger of Berkshire Hathaway; Shelby C. Davis of Davis Funds; Marty Whitman of Third Avenue Value Fund; Jean-Marie Eveillard of First Eagle; Mitch Julis of Canyon Capital; just to name a few.
Each of these great investors studied security analysis and valuation, applying this methodology to manage their multi-billion dollar portfolios. They did this without relying on as-reported numbers.
Uniform Adjusted Financial Reporting Standards (UAFRS or Uniform Accounting) is an answer to the many inconsistencies present in GAAP and IFRS, as well as in PFRS.
Under UAFRS, each company’s financial statements are rebuilt under a consistent set of rules, resulting in an apples-to-apples comparison. Resulting UAFRS-based earnings, assets, debts, cash flows from operations, investing, and financing, and other key elements become the basis for more reliable financial statement analysis.
Every Thursday, we focus on one multinational company that’s particularly interesting from a UAFRS vs as-reported standpoint. We highlight one adjustment that illustrates why the as-reported numbers are unreliable.
This way, we gain a better understanding of the factors driving a particular stock’s returns, and whether or not the firm’s true profitability is reflected in its current valuations.
Hope you’ve found this week’s Uniform earnings tearsheet on a multinational company interesting and insightful.
Stay tuned for next week’s multinational company highlight!
Regards,
Angelica Lim
Research Director
Philippine Markets Daily
Powered by Valens Research
www.valens-research.com


