
Speaker: Robert Spivey
Content:
What does it mean to beat the market? To beat the market, or to outperform in the market, you need to first understand
how you get there. You get there by first understanding what the market is giving you. What the market gives you is
beta.
Beta means you are performing in line with the market. It is what becomes powerful when you start beating the market and
when you start to create alpha. So, how do we create Alpha? The way we can best create Alpha is to start by
understanding those who are great at creating Alpha. How do they create Alpha?
Let us look at the investing greats and what they do. Invest in greats like Seth Klarman. Seth Klarman has generated 20
percent a year since nineteen eighty-three for The Baupost Group. Klarman is something of a legend, if you will, in the
investing community. Why? Because of the fact that he is one of the only people ever known to call his shot, what does
that mean?
He wrote Margin of Safety, a book which is an homage to Ben Graham in terms of understanding what it is that basically
makes Ben Graham an intelligent investor. Margin of safety was one chapter in the book, and it talked about the idea of
how you make sure that you can beat the market.
Seth Klarman wrote a book about this. After he wrote the book, he crushed the market. He called the shot. He said, here
is how I am going to beat the market. Then he did, right from 1999 to 2014, he obliterated the market.
He wrote Margin of Safety in 1991. Margin of Safety is an unavailable book to buy from print because he keeps it out of
print due to the fact that he wants to. In my opinion, it is just because he wants to make it more famous.
The idea behind it is he was so confident of his process to identify and generate Alpha, he was okay with writing the
book and telling you how he was going to do it. Then he did it, because of the fact that he knew his process was going
to be replicable. We want to understand how it is we can figure it out.
Jim Simons, one of the greatest, if not the greatest investor of all time, generated over 80 percent returns a year for
30 years in the medallion fund. This is not the kind of thing that you do by luck. You have to have a process and a
system to be able to do this.
Same way that Bill Miller did, the great from Legg Mason, who has often said he got lucky beating the S&P 500 fifteen
years in a row. You do not get lucky 15 years in a row. You have to have a process, which Bill Miller had.
Similarly, century management generated 16 percent a year. Marty Whitman at Third Avenue is one of the torchbearers for
Ben Graham in terms of a great traditional deep value investor. George Soros of Quantum Fund is another example,
producing 31 percent a year.
Julian Robertson, the investing great at Tiger Capital, one of the first original hedge fund managers is another. Chuck
Royce, one of the best small cap managers in the world. All of these investors understood they had a simple process to
identify Alpha, to pick the right names.
Steven Cohen is another example. You may think Steven Cohen has a bad reputation, but his process for identifying Alpha
has generated himself 13 billion dollars in net worth. Now he owns the Mets. Richard Driehaus, one of the greatest
growth investors of all time, generated 30 percent annualized returns over a 12-year period.
Driehaus, who interesting enough has taught a class at DePaul University with my business partner, Joel Litman, who is
also our Chief Investment Strategist. He has produced 30 percent returns through the 80s and 90s and a small cap fund in
over thirty-five years, he has produced twenty four percent a year.
Subscribe
These kinds of returns are not ones that you can recreate just by getting lucky. You have to have a simple, systematic
process. Most importantly, it has to be simple and replicable for you to be able to generate those kinds of returns.
That is why, for instance, Ken Griffin, at Citadel, is generally 19 percent a year from 1992 to 2018 and is worth ten
billion dollars. We have highlighted Ken Griffin, specifically ahead of this event to highlight how powerful his process
is and why just having one simple process focusing on factors that give you Alpha has generated such phenomenal returns.
It is why the process that we are talking to you about today can do the same things. All of these investment greats
focus on one simple thing.
As Seth Klarman said, they focus on what Baupost focuses on: mispricing. You may think mispricing means that this
company is going to launch a product and it is going to do X and the market thinks it is going to do 50 percent of your
assumption. So, you think you should buy this stock. It is far simpler than that.
"If only one word is to be used to describe what Baupost does, that word should be: 'Mispricing'."
-Seth Klarman

For all these investment greats, a lot of what they focus on is just the mispricing because the market's looking at the
wrong numbers. The market is looking at, as reported, distorted gap numbers.
You cannot trust them. If you start with understanding you cannot trust as reported accounting, you get better results.
Like I said, everyone who is a power user understands they need to fix the accounting statements to be able to really
invest in a company.

"We are witnessing an erosion in the quality of earnings, and therefore, the quality of financial reporting."
- SEC's Arthur Levitt
This starts with the standard setters themselves. SEC's Arthur Levitt, who was the chairman of the SEC in the 1990's,
was law enforcement for US GAAP while in front of the US Congress, and he said we are witnessing an erosion in the
quality of earnings and therefore the quality of financial reporting.
It is similar to the FBI saying in front of Congress, we are seeing rampant expansion in drug cartels. Would Congress
shrug their shoulders and say, okay, fine? No, they would do something about it. Yet he went in front of Congress and
nothing happened. GAAP has only got more problematic since then.
Similarly, in the 1980s FASB, for those of you who do not know, FASB is a standard setting board for US GAAP. If the SEC
is the FBI or the law enforcement agency for US GAAP, FASB makes the rules. They read the laws.
In the nineteen eighties, FASB adopted the statement of cash flows that we all use today. The same cash flows that we
all talk about as a silver bullet that solves all the issues that we have with accrual accounting.
Net income cannot be trusted, the balance cannot be trusted, but cash, cash is real. The reality is, though, when FASB
adopted that statement in the nineteen eighties, three of the seven members of FASB voted against it. Those three of the
seven members of FASB said it was it was misleading; it was inaptly named and likely to be misunderstood.

"Internally inconsistent; misleading; confusing; inaptly named; likely to be misunderstood..."
- FASB's Lauver, Leisenring, sweringa on the statement of cash flows
Now, I have worked with a lot of accountants over the last 20 plus years. There are few more damning things that an
accountant can say than those words right there. Yet, we all talk about it as a silver bullet that solves all these
issues.
Subscribe
In reality, it is even more problematic because of the misclassification that goes on in the statement of cash flows.
Ironically enough, there was a fourth member of FASB that was on the fence about adopting the statement of cash flows.
That fourth member of FASB said, you know what, we need something, so let's adopt this and we can fix it in the future.
They never fixed it.
So, everyone thinks is the solution to the as reported accounting issues of the income statement and balance sheet. In
reality, it is more problematic.
"The fact that IFRS provides more opportunity for the application of judgement... only adds to the risk"
- Dr. Barry Jay Epstein
This is not just an issue with US GAAP. It is not like it is any better in the international accounting standards of
IFRS. Barry Epstein, who is the author of GAAP for over a decade highlights that and also has written similar statements
around IFRS, the Bible of accountants, if you will, highlighting that IFRS is more problematic than GAAP because it
provides more opportunity for management judgment and discretion in the preparing of the financial statements.
It is interesting with US GAAP even though things are wrong, like how we deal with R&D expensing risk capitalization,
everyone has to do it the same way. Since everything is uniformly wrong, that means when you have to fix something for
one company, you fix it the same way for the other companies.
The issue with IFRS is that it is a framework for accounting as opposed to a rules-based system. As a result, management
teams have discretion.
For instance, if I look at R&D, I can decide, do I want to expense this research and development by making it all
research or do I want to capitalize all of this research and development by making it all development. Or do I want to
do something in the middle?
You might say it is the accountant’s job is to review management's decisions. Do you think any twenty-five-year-old
staff accountant is possibly going to argue with a forty-five-year-old CFO or fifty-five- or six-year-old CFO who is
saying, no, this is how much of my expenses were development and need to be capitalized? This much should be expense
because of research.
Of course not. What you get is inconsistency, not just company to company and how they apply their accounting standards
year to year for the same company. You get inconsistencies with IFRS that mean you cannot even compare company versus
itself historically.

"A lot of what Wall Street does has nothing to do with the underlying value of a business."
- Marty Whitman
We mentioned Marty Whitman earlier in terms of one of the greats for investing in one of the torchbearers for Ben Graham. He often rails against issues in as reported accounting, saying things like Wall Street has nothing to do with the underlying value of a business.

"To be successful, you should concentrate on the world of companies, not arcane accounting mathematics."
- Warren Buffett
Buffett says to be successful, you should concentrate on the world of companies, not arcane accounting, mathematics.
Buffett and Charlie Munger in their Berkshire Hathaway's two of the last three most recent annual meetings opened the
conversation by railing against how as reported net income is meaningless for Berkshire Hathaway and does not reflect
anything about its returns.
Subscribe
The idea of what they are talking about here is because Wall Street focuses on the as reported accounting statements and
the as reported accounting statements have nothing to do with economic reality.
The arcane accounting mathematics of as reported accounting statements do not relate to the world of companies and the
underlying value of a business. When you are listening to Wall Street, you are literally getting a garbage in, garbage
out number.
You need to fix the results to be able to understand what is going on. Jim Chanos, the great short seller, says much the
same for credit, it is not just an equity issue.
Rating agencies upgrade and downgrade after the moves already happened because they are using as reported accounting
data. They are seeing lagging signals that have nothing to do with reality. If you are doing that, you are getting bad,
slow data.
Here at Valens Research, we make over one hundred and thirty different adjustments to solve all of the issues with the
as reported accounting for over thirty-two thousand companies globally.
Same as to those power users from the last two slides we are discussing. And to get closer to the kind of data that
those investment greats who are consistently creating Alpha are seeing. We make fixes around things like mergers and
acquisitions, distortions for R&D, for revenue, leases expenses versus capitalization, cash versus non-cash charges, and
stock options.
We fix all of these and over one hundred and twenty-five other different adjustments to get to a uniform standard, what
we call uniform adjusted financial reporting standard UAFRS or Uniform Accounting.
And two incredibly powerful things that are essential to good stock pickers happen when we do this.
The first thing that happens is everything is uniform. Uniform, meaning you can compare, let's say, ExxonMobil United
States to Unilever in the U.K., to China Mobile in China, and know when you're making an investment decision across
those three companies, you have comparable data. So, you are making a good, if you will, opportunity decision in terms
of where you are best deploying capital.
The second and almost more important thing is it gets us to a closer representation of economic profitability, of
economic growth, and economic valuations. When we are making decisions, we know what a company is doing. We do not have
the bad data that is in the as reported accounting statements to stop us.
We can see this better data is clearly what the investment greats are looking at too.
Seth Klarman does not use as reported data. The below chart highlights Baupost’s largest holdings and we have the as
reported return on assets for these companies and we have the Uniform Accounting return on assets (ROA’) once we make
all of our fundamental adjustments.
The Baupost Group Holdings: Uniform vs As-Reported ROA
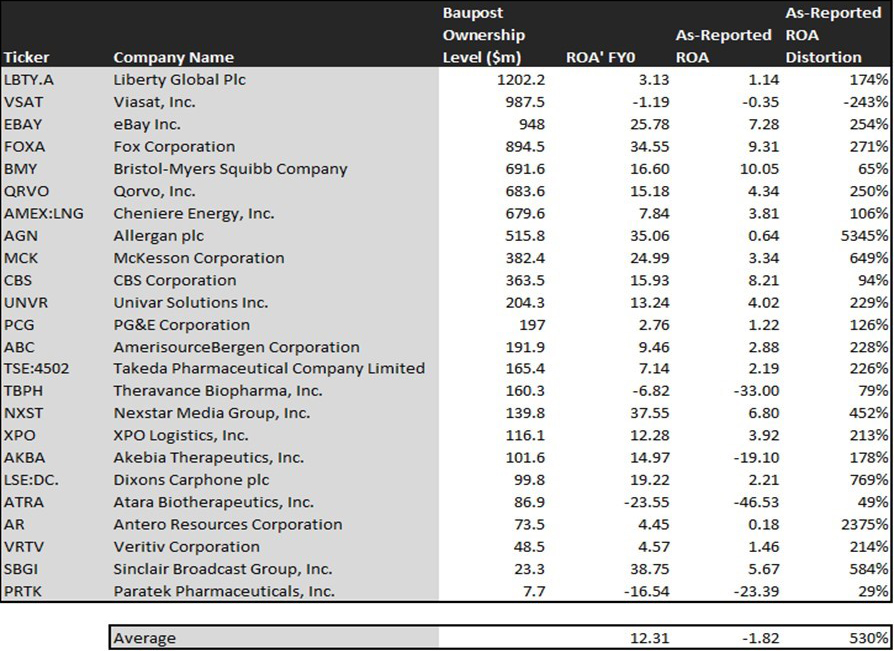
We can realize that eBay is not a seven percent of ROA company, it is a twenty six percent ROA company. Allergan is not
a zero percent ROA company; it is a thirty five percent of ROA company. XPO does not generate four percent ROA, it is
twelve percent. Importantly, Akiba Therapeutics not a negative nineteen percent ROA company. It is actually a 15 percent
ROA firm.
Subscribe
This is no wonder that anyone who is looking at the as reported metrics is scratching their head. Look at the average
company for Baupost in terms of ROA. On an as reported basis, it is negative two percent.
That does not look like the kind of stocks a company run by a great investor would be buying. In reality, the ROA of
those businesses is 12 percent.
We can see the same with great growth investor Richard Driehaus. He is not buying low return businesses and hoping they
grow; he is buying high return businesses that can also grow.
Trade Desk is not a six percent ROA business. It is a 40 percent of ROA business. If we look at a name like Wingstop, it
is not a 20 percent ROA business. It is a two hundred percent ROA business that is franchising like crazy.
Her is another example. The below chart highlights Chuck Royce’s largest portfolio holdings.
Royce Investment Partners Holdings: Uniform vs As-Reported ROA
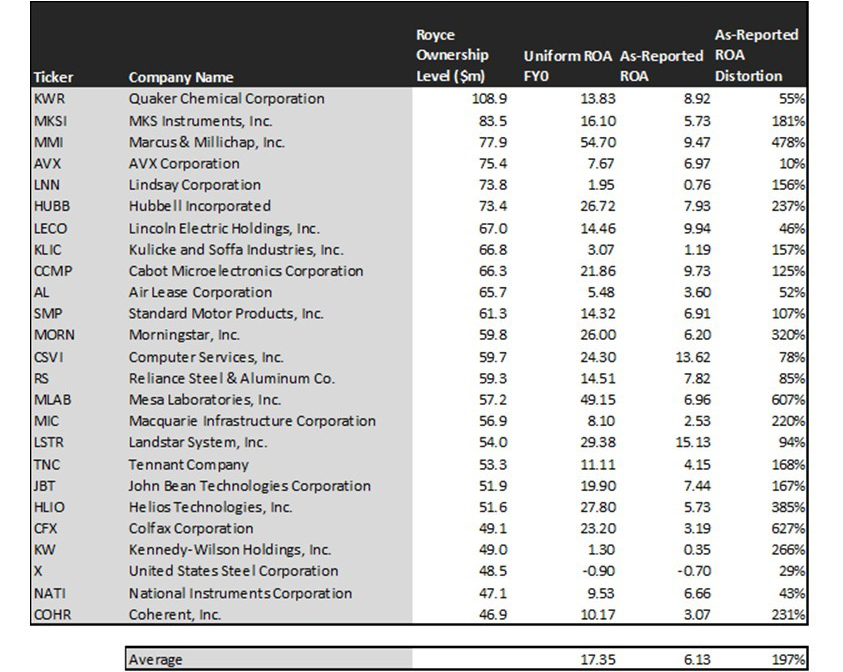
Chuck Royce is a small-cap investing great. Chuck Royce is one of the most respected, if you will, margin of safety,
small cap investors, where he buys great companies that can grow at low valuations.
The companies he is identifying are names where he is cleaning up the accounting just like we are. That is the big
mispricing he is identifying.
Jim Simons is not buying names that have a nine percent ROA. He is buying names that have a thirty four percent ROA.
And of course, Warren Buffett. The below chart depicts Berkshire Hathaway’s largest portfolio holdings.
Berkshire Hathaway Holdings: Uniform vs As-Reported ROA
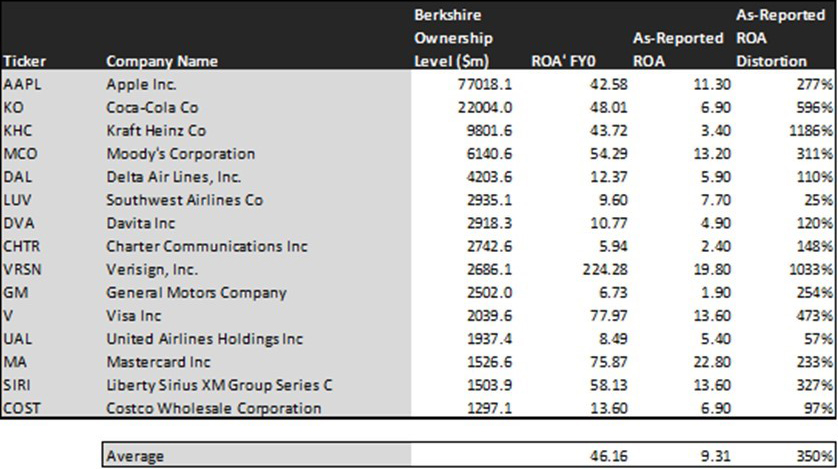
Buffett would not buy a bunch of companies that have a five percent ROA. When he is buying Coca-Cola, he is not thinking
Coca-Cola has a seven percent ROA, he is thinking he has a forty eight percent ROA that has a defensible economic moat.
I can own this business and I can know as it grows and as people realize the valuations, they realize how wrong as
reported metrics are. This is why the average company on his list is not nine percent, it is forty six percent.
What we have done is we have created a system, a very simple process, using Uniform Accounting data, the same better
data that investment greats use.
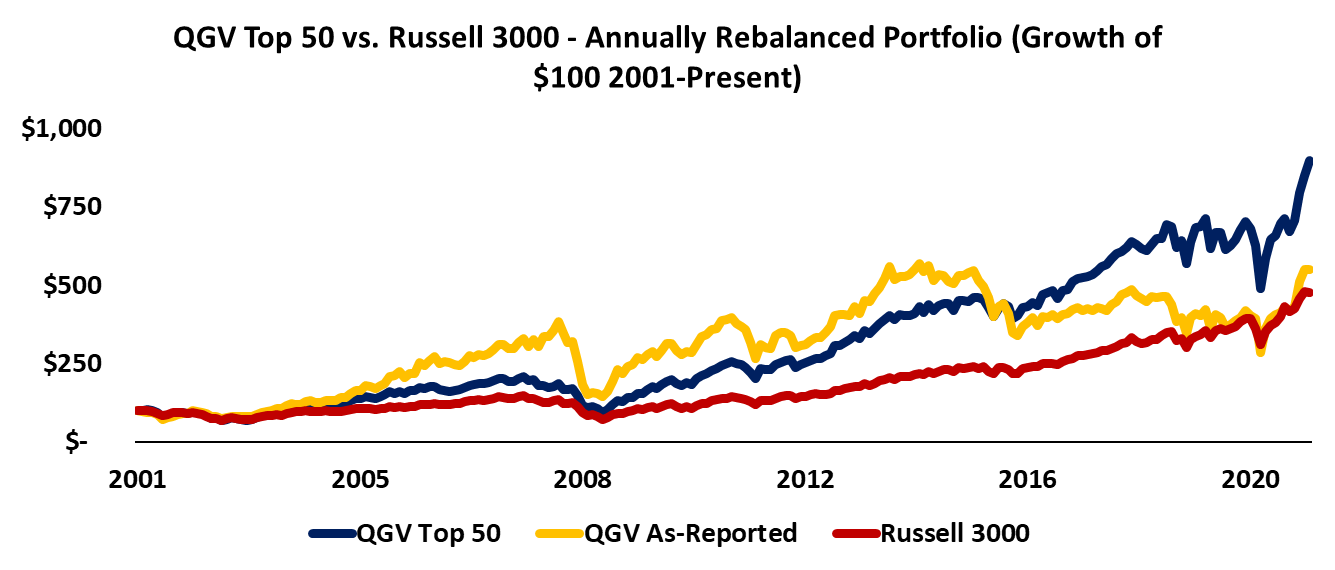
Three simple variables to identify companies that are set to outperform and what we have done is we've run a back test
of this of this framework over the last 20 years. We can see the Russell 3000 has done 7.6 percent a year over that
period.
Subscribe
We did the exact same process that we are going to tell you about. Using as reported data, we have performance in line
with the market with an important lesson I will cover in a moment, but if we use a Uniform Accounting data, we get a
performance 1.5 times the market in terms of the kind of signals and insight that we are seeing.
The important thing is it is still working. The powerful thing about this is if you look at this yellow line is the as
reported QGV quality, growth and value, the red line, the Russell 3000, the blue line, the QGV top 50 are Uniform
Accounting framework that mirrors these investing rates.
What you can see is the as reported QGV, sure it is performed in line with the market. But if you have invested in it
since two thousand seven, it is actually flat. All of the returns and the benefits from this framework came before 2007.
Since then, using the simple framework of buying the best, highest growth, lowest valuation companies have been a bad
strategy using as reported data.
You know why? It is not because the fact that those companies should not outperform, it is because of the fact that the
as reported accounting data cannot be trusted and all investors who know are avoiding it.
That is why when you are looking at as-reported metrics and you are scratching your head thinking why these great
companies are I am buying not performing is because they are not great.
You are not seeing because you are using bad data as opposed to when you use the Uniform Accounting data, which has
consistently outperformed the market and still does because we are identifying those real same kinds of companies that
the investment greats are.
We are seeing signals like we saw on Facebook back in 2013. In 2013, Facebook stock dropped from forty dollars to
twenty-five dollars.
The market was concerned about monetization and the move to mobile and whether or not Facebook could get to do it. And
what the market was seeing on an as reported basis was a firm trading at a 40 times multiple that has issues with
monetization.
Just as importantly, we have got a company that is already not very profitable. These orange bars are the, as reported,
distorted returns and valuations for this company. And the markets are staying away and also returns are weak just to
back up.
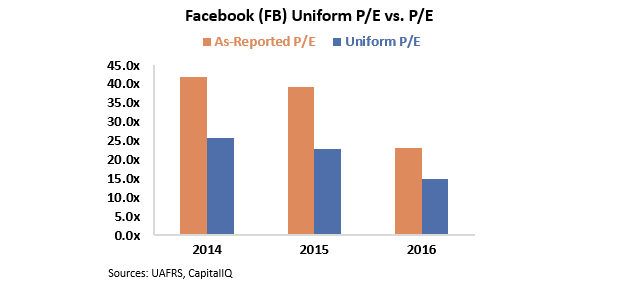
But if we look at these charts, this first chart here is the as reported P/E, this orange bar and in our Uniform
Accounting adjusted P/E, the blue bar. High P/E means an expensive company. Low P/E means inexpensive company.
Subscribe
Well, we can see in 2014 when these issues were cropping up still, the market thought this company was trading at forty
times. But the market average valuation was around twenty or twenty-five. The company was really trading at around
twenty times. The company was trading at market average valuations, something market valuations that use as reported
metrics did not show you.
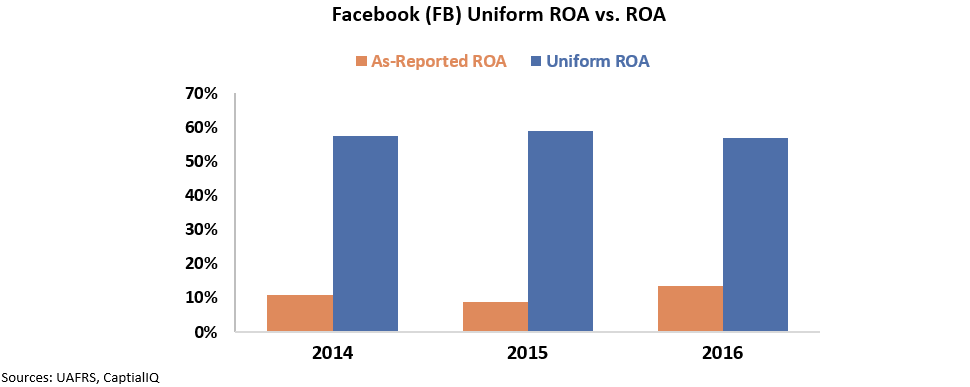
These orange bars are the distorted ROA's of the business. The blue bars are Uniform Accounting. You were seeing a
business in 2013, that you thought had issues with execution, already had low returns and at high valuations.
So, you want to run from the hills if you were looking at this bad data. But under Uniform Accounting, what we could see
was returns were actually very robust, almost 50 percent. That is five times the market average.
On top of that, valuations were low, and we thought we were seeing an inflection where mobile was starting to be a good
execution for Facebook, which is why Facebook took off and why, since we identified it in in that simple signal, the
stock is up over a thousand percent.
Looking at Uniform Accounting versus as reporting metrics shows you how completely wrong those signals can be.
Similarly, back in twenty fifteen, we were actually highlighted in Barron's because the fact that we were making a very
important but very controversial call, we were saying we did not think AMD was going to go bankrupt and AMD could
execute on its turnaround.
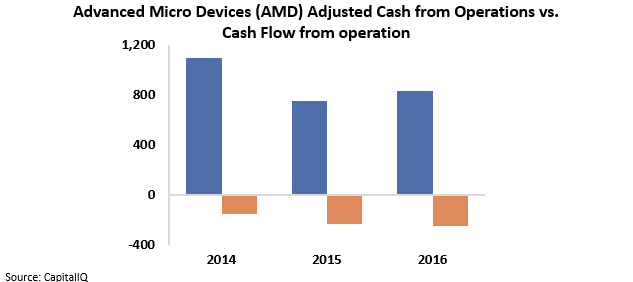
The biggest reason why was this chart right here. AMD in 2015, it is crazy to think about now because now obviously AMD
is, you know, tens of billions of dollars in market cap, but in 2015 it was priced to go bankrupt.
The stock was around two dollars. The reason why was because these orange bars are the as reported, distorted cash flows
from operations for AMD. Remember what I told you earlier? You think you can trust the statement of cash flows. You
cannot even trust the statement of cash flows.
It was saying AMD was a negative cash flow business just from operating cash flows. That is catastrophic.
In reality, we could see in those blue bars, the Uniform Accounting bars was it is not that AMD had negative cash flows.
It is that AMD had actually very positive operating cash flows. They were just over investing in the business.

We were able to see those signals talking to Rob Blumenthal over at Barron's we were able to highlight, no, AMD is not
going to go belly up, AMD is actually primed with a rate turnaround, which we thought it was going to have with the CEO
to be able to turn things around.
That is why from bankruptcy it was from twenty dollars and fifty cents up to north of seventy-five dollars.
Another example is Planet Fitness. It was viewed as a dog back in 2018. Nobody wanted to touch it when I when it went
public. Why. Because it was a hairy as it was a hairy private equity sponsored company that had complex financials like
chargebacks and obligations to the, to the private equity sponsor.
Because of that, the as reported returns on this business were incredibly low. Not only were the as reported returns on
this business low for a gym, a boring gym, valuations were incredibly high.
What we saw was completely different because we were using Uniform Accounting data. We saw a few things.

Valuations were not that expensive. It was trading around market average multiples and returns were phenomenally robust returns for the gym business because it was a franchising business.
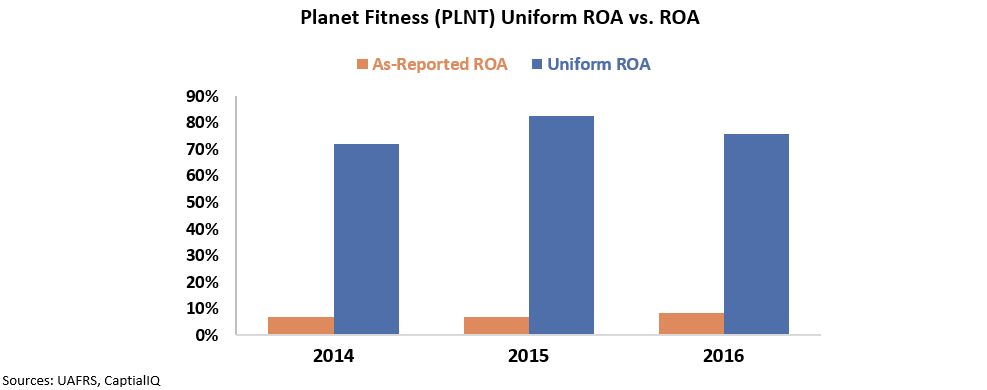
Returns were north of 80 percent and the company was growing massively.
Because of that, from when we recommended it in 2018 to 2019, it was up over two hundred percent. And those are just a
couple of the examples of the kind of signals that we see when we are using powerful Uniform Accounting metrics and a
very simple framework to identify the exact same kind of signals that the investment greats use to crush the market.
Below are some Uniform Accounting winners.
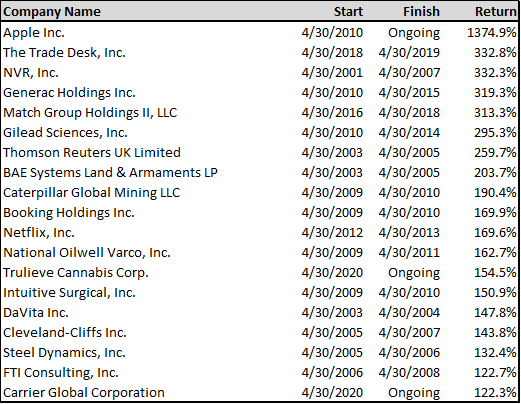
Signals like when we saw Apple in twenty ten before it continued to be on our what we call the QGV50. Right. And as
return fourteen hundred percent of the trade does that in a year return three hundred percent. NVR, Generac, Match,
Gilead, all three hundred percent winners.
Thomson Reuters, BAE, Caterpillar all two hundred percent winners. Bookings, Netflix, National Oilwell Varco, all these
other names all winning, delivering over one hundred percent returns. We were able to find these signals just by using
the simple framework.
Subscribe
This simple framework is not just making us identify the idea. It is making investment greats listen to the data that
Valens Research is producing. Just for context, two hundred of the top three hundred investment firms in the world read
the Uniform Accounting data that we are talking about right now, including nine of the top 10 firms.
It is why we are in the top five percent of investment analysis consumer in FactSet, because people know they need to
get the right numbers. The right numbers can lead to those same kinds of alpha generating returns like the investment
greats, the same kind of returns that could lead us to having returns that are 1.5x the market using this simple
framework.
With that in mind, I am sure you are wondering, so what is the framework? Like I said, it is as basic as basic can be.
Highest Quality - Uniform Return on Assets
Strongest Growth - Uniform Asset Growth
Lowest Valuations - Uniform Earnings Yield (Uniform P/E)
All we do is using better Uniform Accounting data, we rank the companies in the investment universe by the highest
quality companies based on their highest uniform return on assets, how profitable they are.
Then we rank it on the strongest growth, which ones are reinvesting the most in their companies based on uniform asset
growth? This is about how much can they deploy into their business and keep returns high with the lowest valuations.
We want the companies with the lowest PEs or, if you will, the highest uniform earnings yield. And that is where we get
the name QGV quality, growth, and value.
The top 50 ideal investment candidates, the 50 names in the US that rate the best on those three incredibly simple
metrics.
Sign up today and we will give you this report containing the top 50 stocks each month, that is 12 times per year! For a
limited time, we are offering this product for only $50, far less expensive than any other quality research and top
performing stock picks you will see across the whole market.
Additionally, by subscribing to the QGV 50 monthly report, you will be receiving tremendous value and research that 9
out of the top 10 funds currently read. Each name on our stock list has had thoroughly cleaned up accounting data,
ensuring our paying customers are only investing in companies with real data that confirms they are strong, high-growth
firms, at cheap valuations.
It is so simple, and it is insane that it can produce these kinds of returns, generating massive alpha above the market.
This process has been back tested and emulates much of the strategies used by the investment greats. You can subscribe
and gain access to the report right now, by using the below link.