
Credit Markets Exaggerate Noble Group’s Credit Risk
Summary
- Moody’s Ba3 credit rating on Noble Group Limited understates the company’s credit risk. We rate the company two notches lower, as a highly speculative, high-yield credit.
- Noble’s credit risk is higher, given fundamental headwinds to the firm’s business, their multiple material debt headwalls, and their lack of concrete management compensation metrics.
- However, credit markets are grossly overstating credit risk with a CDS of 2,183bps and a cash bond YTW of 19.188%, relative to our Intrinsic CDS of 377bps and Intrinsic YTW%.
Cash Flow Profile
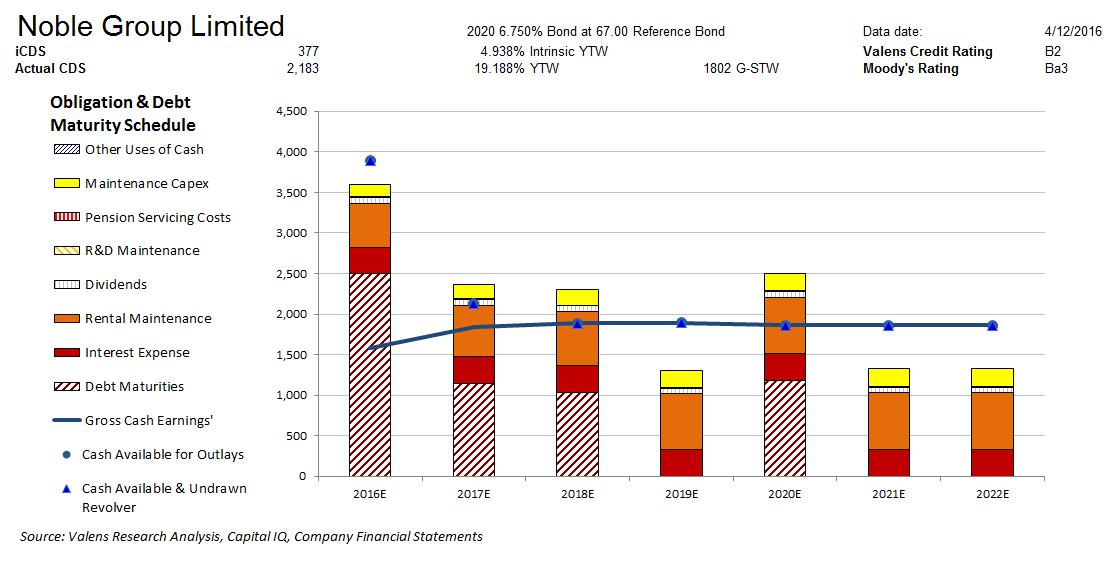
Moody’s is understating the credit risk of Noble Group Limited (OTCPK:NOBGF) with its Ba3 rating. Our fundamental analysis highlights a riskier credit profile for Noble. While the company’s cash flows should be sufficient for handling operating obligations, they have multiple material debt headwalls that cash flows and cash on hand will not be able to service. We, therefore, rate Noble two notches lower at an HY2 credit rating, or a B2 equivalent using Moody’s ratings scale.
On the other hand, based on the firm’s strong recovery rate and stated intent to refinance debt maturities, credit markets are grossly overstating Noble’s credit risk with a CDS of 2,183bps and a cash bond YTW of 19.188%, relative to an Intrinsic CDS of 377bps and an Intrinsic YTW of 4.938%.
We’ve included our Credit Cash Flow Prime™ chart for Noble Group Limited. The chart provides a far more comprehensive view of credit fundamentals than traditional ratio-based analyses. By using Uniform Adjusted Financial Reporting Standards based metrics, it shows the cash flow generation and cash obligations related to the credit of the firm, adjusted for non-cash financial statement reporting distortions from GAAP. The blue line indicates the gross cash earnings (UniformFRS adjusted cash flow number) expected to be generated based on consensus analyst estimates and Valens Research’s own in-house research team. The blue dots above that line include the cash available at that time while the blue triangles indicate that same amount plus any existing, available lines of credit.
Click here to read the article in its entirety at Seeking Alpha.


