
How to Calculate Uniform Return on Assets (ROA)
Updated April 21, 2020
Arcane Accounting Mathematics: Destroying Valuations and Shareholder Wealth
Traditional financial analysis metrics tend to muddle our insight on the intrinsic value of a company. Rather than focusing on the ability of a company to create value, which is the primary goal of the intermediate to long-term investor, these metrics lead the investors to focus on activities that do not necessarily contribute to the creation of shareholder wealth.
Modern day analysts are fixated with the use of metrics such as P/E (market price of each share to earnings), EPS (earnings per share) momentum, absolute P/E, and PEG (price-to-earnings growth) ratio. By virtue of simplicity and wide acceptance, these formulas serve as a proxy for cash flows and a basis for executive compensation and incentive plans. However, we often overlook certain and significant flaws that are embedded in their calculation when using these metrics. First and foremost, they fail to address the principal focus of an investor over the intermediate to long-term horizon for value creation—how much economic value has been and will be created from the funds invested and deployed by a company. Secondly, these metrics are vulnerable to manipulation and misappropriations (Enron and Sunbeam would be striking examples of the failure of these metrics to defend against accounting manipulations). Also, these metrics fail to distinguish between operating and financing decisions, which are core to properly value and evaluate the company and its management. Finally, they fail to take into account risk, capital requirements, and the time value of money.
In addition to the fundamental deficiencies of the traditional metrics, statistical evidence doesn’t show a clear relationship between market prices and these value indicators. Using traditional metrics, the market would seem to be irrationally pricing securities. This can be shown by utilizing the example of the PEG ratio. By simple induction, it could be hypothesized that these two variables would exhibit a strong positive correlation; the higher the EPS growth, the higher should be the P/E multiple of the company. However, empirical studies have shown very weak correlation between the two variables; and worse, even exhibiting negative correlation.
Below is a chart showing the relationship between P/E and EPS growth for Semirara Mining Corporation (SCC:PHL) and its regional peers. It is evident that P/E and EPS growth do not show a strong relationship.
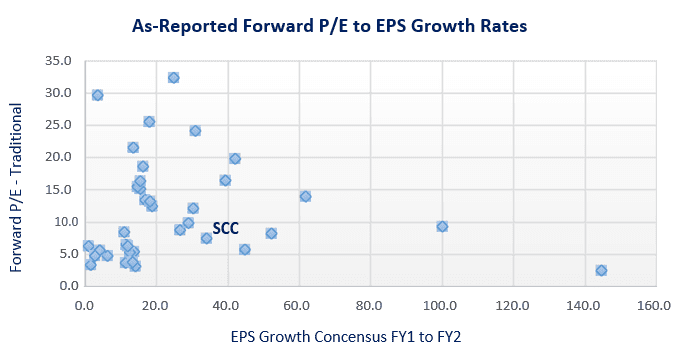
Why then does this phenomenon take place? This is simply because the metric does not capture the risk inherent in the business, the capital needs, and the true economic returns generated by the business. For these reasons, traditional valuation models fail to reveal the predictive power of valuation models.
With regard to the PEG ratio, aside from all the aforementioned deficiencies, the main flaw of this metric lies in the fact that it puts a lot of emphasis on EPS growth as a driver of valuation. As observed by Warren Buffet though, not all EPS growth is desirable in relation to the creation of shareholder wealth. If EPS growth is generated by deploying enormous amounts of invested capital into a venture that doesn’t generate a return above the cost of capital, this would not contribute to the creation of wealth; worse, this might even destroy wealth. As Warren Buffet says, growth is only beneficial when the incremental returns are greater than the incremental investment; when a dollar used to finance the growth creates over a dollar of long-term market value.
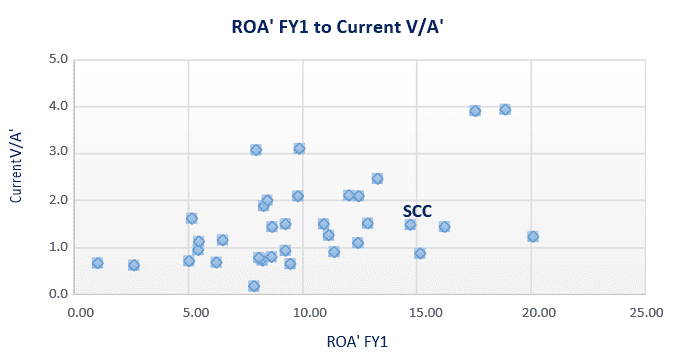
A V/A′ to ROA′ (Uniform enterprise value over Uniform asset to Uniform return on assets) valuation addresses the fundamental deficiencies of the traditional or generally accepted accounting principles (GAAP)–based metrics. Uniform ROA, or simply ROA′ accurately measures what is supposed to be the core driver of valuation–the ability of a business to invest its capital at enticing incremental returns to create long term market value. It is a superior metric with which to assess value creation and at the same time, more accurate than traditional or GAAP-based metrics. Essentially, a higher ROA′ firm should receive a higher valuation, or V/A′ multiple, which is a cleaned-up version of the P/B (price-to-book) ratio. In contrast to other traditional metrics as seen historically, V/A′ and ROA′ exhibit a strong positive correlation. Using this valuation model, it appears the market is pricing the securities rationally.
Below is a chart showing the relationship of V/A′ and ROA′ for Semirara Mining and its regional peers. In contrast to the P/E to EPS chart above, the V/A′ to ROA′ chart illustrates a strong correlation between ROA′ and valuation.
The next section will attempt to compare and contrast the different tools for assessing management performance.
Return on Asset and other Performance Metrics
RONA – Return on Net Assets
Analysts have frequently been using RONA, ROIC (return on invested capital), ROC (return on capital), and ROTA (return on total assets) to assess overall company and management performance. However, performance measures that employ “net assets” as the investment base can be significantly distorted. Consider the following example:
Assume you invest $200 to build a lemonade stand business:
- With $200, you purchase $100 in lemons and sugar, and another $100 for a lemonade stand
- Lemonade stand has an estimated useful life of 5 years
- Sales of $130 and Cost of Sales of $100
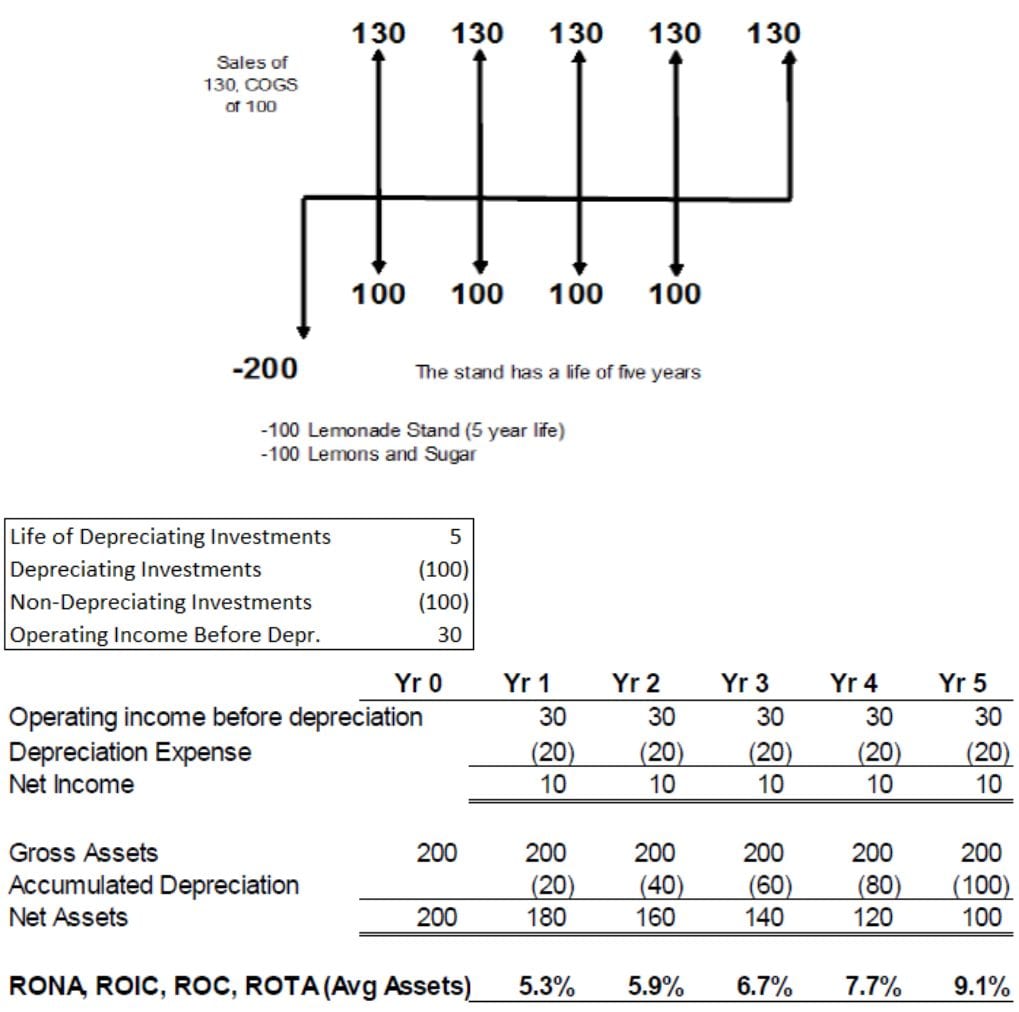
RONA is calculated by dividing net income over the average net assets for two years. As seen in the table above, RONA is 5.3% in year 1 and gradually climbed to 9.1% in year 5. Yet, theoretically, the economic performance of the company did not really change. Profits neither increased; nor did the margins and turns. Therefore, ROA should remain constant.
So, why did the “net assets”-based ROI increase over time? This is due to the “old assets” distortion in later years. As the year progresses, accumulated depreciation by the company increases, which in effect, decreases net assets and increases RONA. Thus, RONA is a poor measure of average projected cash flow returns; especially when significant depreciating assets exist, as it results in distorted performance measures. A reliable performance metric should show consistent return levels to a project that is performing at the same level over time assuming zero growth. To achieve this, net-to-gross PP&E (property, plant and equipment) should be stable throughout the years. Another alternative is to calculate the economic depreciation. However, economic depreciation in practice is extremely difficult to determine.
CROGA – Cash Flow Return on Gross Assets
CROGA is calculated by using gross operating cash flows as the numerator and average gross assets (for two years in the example) as the denominator. Using the same data on the lemonade stand business, calculations of CROGA are seen below.
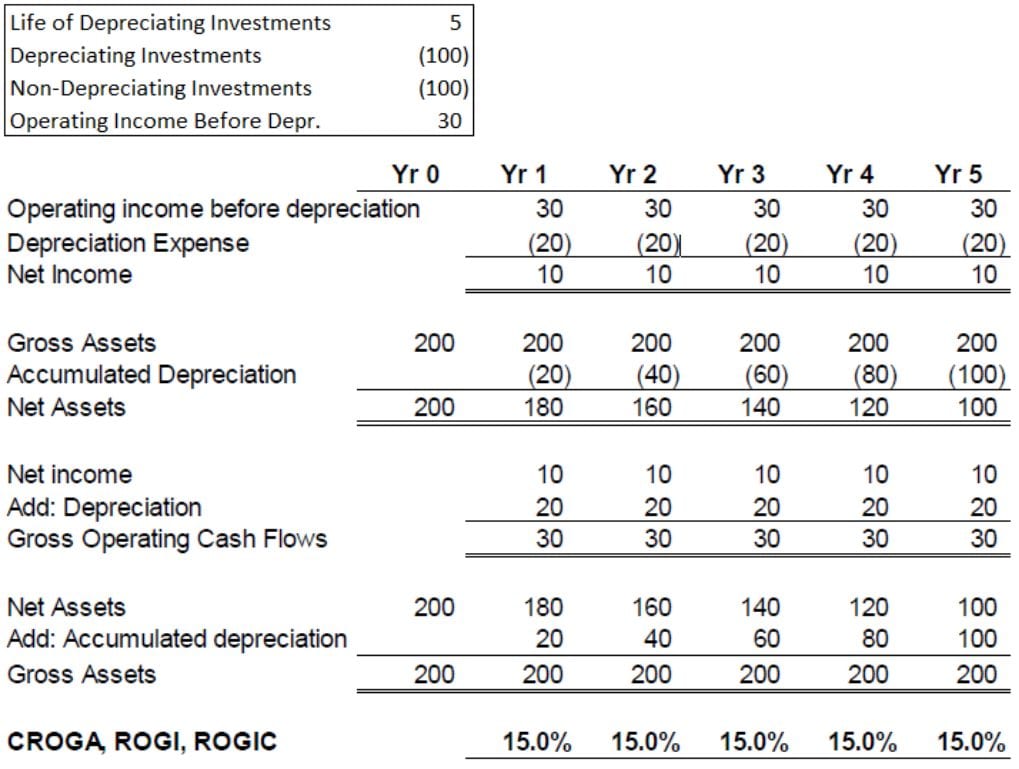
Given the business is stable in terms of its profit, margins, and turns, CROGA shows consistent returns over time. But, CROGA is susceptible to distortion as it gives inflated estimates. It does not take into account the expenses incurred by the company such as depreciation expense. Depreciation, even if it is a non-cash charge, is still a very real expense. The purpose of depreciation is to basically match profit with the expense it took to generate that profit, thus, providing an accurate view of the company’s earning power. Ignoring the economic reality of depreciation will lead to overvaluation of the business with deficient returns.
For illustration, let us use the lemonade stand business example and decrease the operating income before depreciation to $20 from $30. Calculations are seen on the following page.
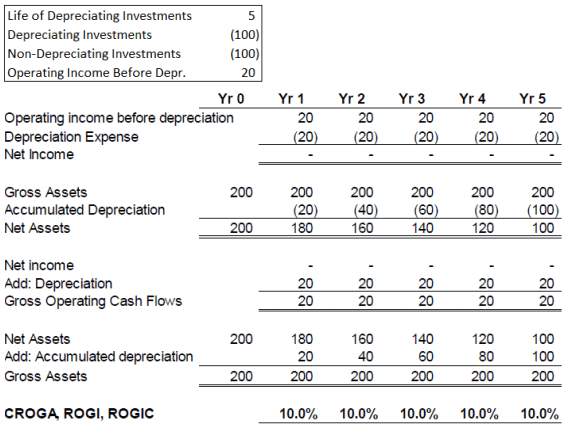
As shown above, CROGA reports positive returns even when there are no real cash flows generated (net income is zero). A good performance metric must reflect the recovery of the “principal” first before any real return on investment can be realized.
Rated-based CFROI – Cash Flow Return on Investment
CFROI provides an estimate of the internal rate of return (IRR) of the firm if this year is indicative of future years. IRR is the discount rate that, when applied to a stream of cash flows, discounts all of the cash flows back to a net present value of zero. It is basically the rate of growth that a project is expected to generate.
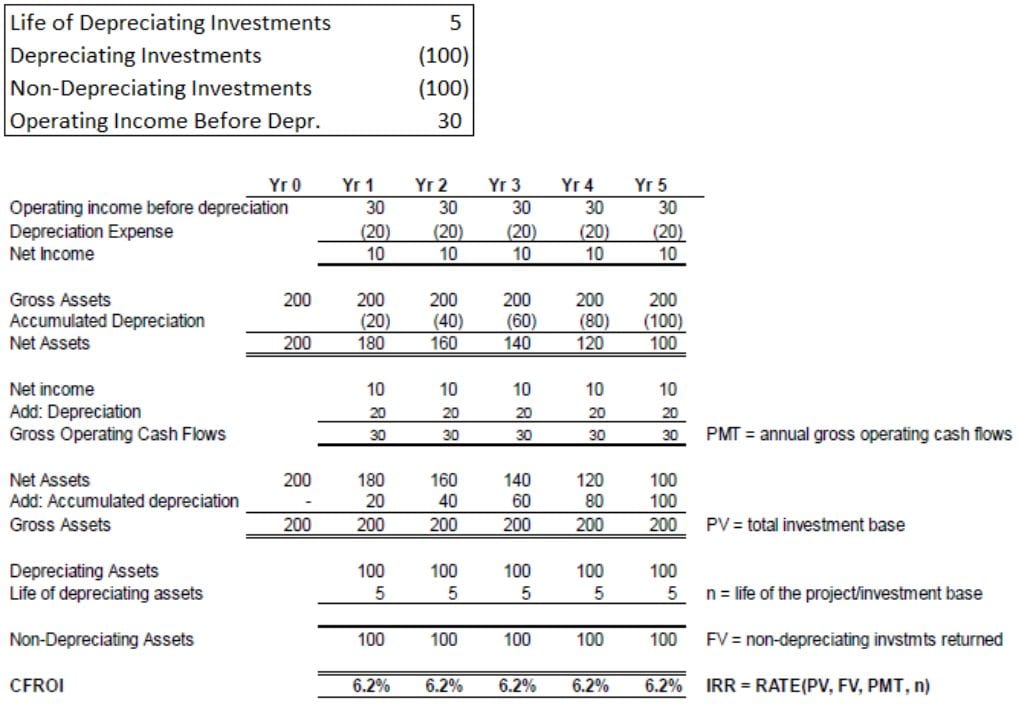
In any given year, the real return on investment is based on the existing investment base (average through the year), operating cash flows, asset mix, and asset life. CFROI is an excellent measure with which to judge levels of, and trends in a firm’s economic performance, which then can be used to help forecast ROIs on future projects. Generally speaking, CFROI is calculated using IRR as mentioned earlier. But IRR is quite difficult to comprehend, especially to those who have no heavy finance, engineering, or mathematical background, and may have more than one solution when cash flows shift from positive to negative (or vice-versa). This will be discussed in more detail later on.
Uniform ROA (ROA′)
Uniform ROA, or simply ROA′ (pronounced as “ROA prime”), is the cleaned-up version of the traditional ROA metric. It is calculated by dividing Uniform earnings by Uniform net assets. The term “Uniform” indicates that these metrics are adjusted under the Uniform Adjusted Financial Reporting Standards (UAFRS or Uniform Accounting) to remove distortions, some of which are mentioned previously, to provide a more accurate measure of company performance.
Using the same data on the lemonade stand business, calculations of Uniform ROA are illustrated below:
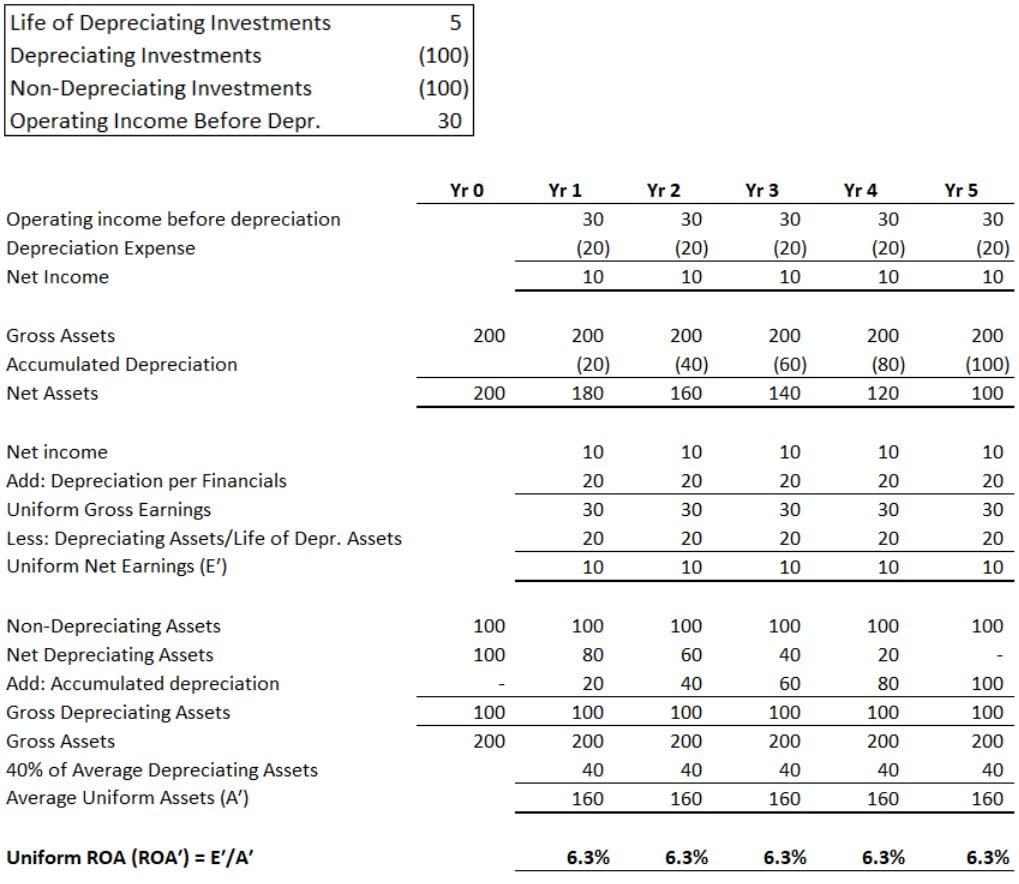
Uniform ROA is a more reliable metric as it reflects the capital recovery cost and full value of the original investment. It is the closest potential approximation to a real economic return on investment as it reconciles with total projected cash flows.
ROI Comparison
Let us compare the different ROI computations using the data on the lemonade stand business.
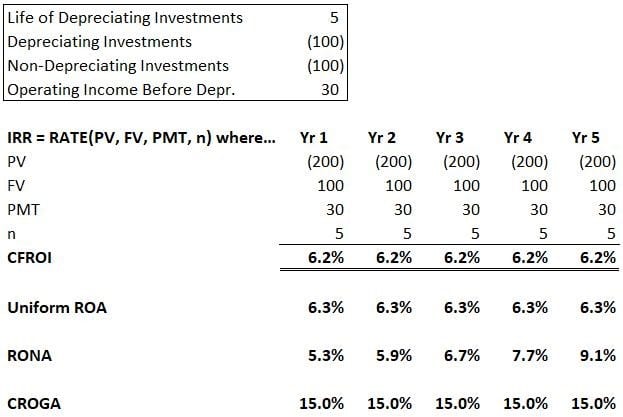
As the table above shows, RONA grossly misestimates the true value of the investment base on a year-by-year basis, and CROGA is inflated, as it does not account for the depreciating quality of the assets base. Uniform ROA gives the closest estimate to CFROI and the difference is immaterial.
Let us try recalculating the lemonade stand business assuming all $200 are spent on non-depreciating assets.
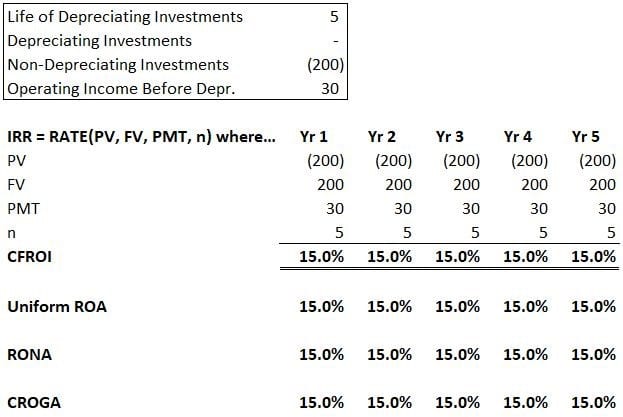
Even without the lemonade stand, the business can still generate positive returns. Since there are no fixed assets included in the computations, all estimates yield a 15% return.
Let us try another scenario where all $200 are spent on depreciating assets.
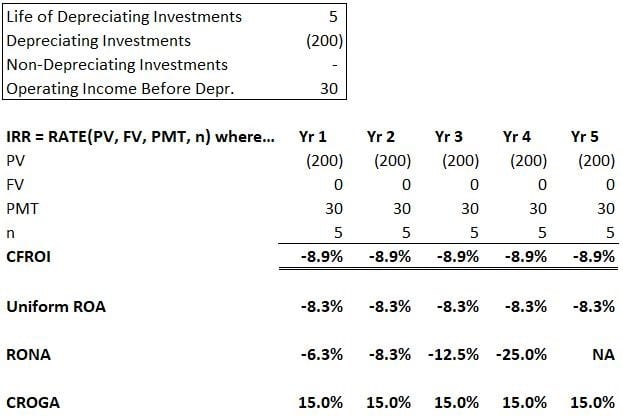
When a business has only fixed assets (lemonade stand) and no working capital (lemons and sugar), the business would not be able to operate. Despite the positive returns exhibited by the CROGA metric, the company would still be operating at a loss. CFROI and ROA Prime reflect the negative return incurred by the company.
IRR and ROA
IRR is an indicator of the yield of the investment. However, IRR assumes equal rates of return on the reinvestment of cash flow. Therefore, if the company encounters headwinds, IRR may be overstated (sometimes significantly). ROA, on other hand, provides a snapshot of IRR. It computes for the yearly performance without any influence from prior years. But, ROA breaks down when the cash flows are very high or very low. Thus, Uniform ROA is the most reliable performance metric.
Making the Adjustments
Traditionally, the figures derived from balance sheet, income statement, and cash flow statement have been used to measure the ability of a firm to generate returns over and above its cost of capital. According to the DuPont Formula, ROI is a function of margins and turns. ROI is equal to net income/sales multiplied by sales/total assets. The same goes with Uniform ROA as it is also a function of margin and turns. However, to be able to capture the true value of the firm, these financial statement figures have to be adjusted. For a Uniform ROA calculation, instead of using net income as the numerator of the margins calculation, one must use Uniform earnings (E′). And for the denominator of the turns, Uniform assets (A′) is used. Hence, the DuPont formula is revised as E′/sales x sales/A′. Sales figures are then cancelled out, leaving the ratio of E′ and A′ which gives the amount of net cash flow generated per unit of real assets.
Uniform earnings is the equivalent of EBITDA (earnings before interest, taxes, depreciation and amortization) in discounted cash flow valuations. But, it has to be adjusted to remove all possible distortions that might be embedded in its calculation due to different accounting practices among companies. The computation for Uniform earnings is a two-step process. First, the Uniform gross earnings has to be calculated. Afterwards, the value from the first step has to be adjusted for asset maintenance related cash flow. A sample calculation and formula of the Uniform gross earnings can be found on the next page.
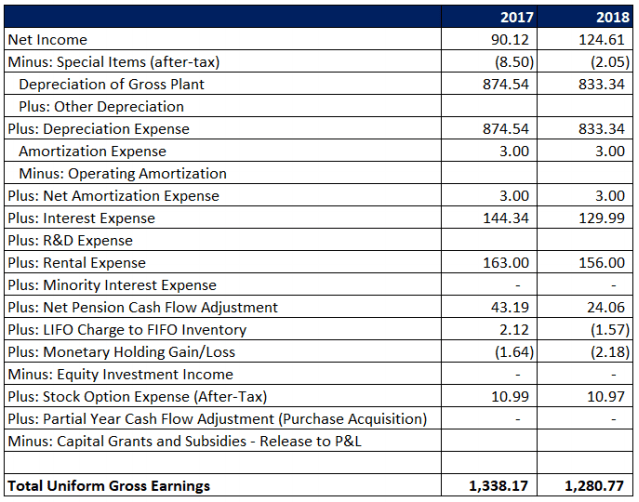
Among the balances added back to net income are the following: depreciation expense, net amortization expense, interest expense, R&D expense, rental expense, minority expense, net pension cash flow adjustment, LIFO charge to FIFO inventory, monetary holding gains, after-tax stock option expense, and partial year cash flow adjustments for purchase acquisitions. Monetary holding gains are changes in the value of assets or liabilities that might accrue over time because of inflation. Adjustments related to depreciation, amortization, and holding gains are done to convert the net income into actual cash flows. The other adjustments (R&D expense, pension, interest expense, etc.), are done in order to capture the real ability of the company to generate cash flows by considering expenses which had been distorted by accounting standard application.
On the other hand, the balances subtracted from net income are the following: after-tax special items, equity investment income and capital grants and subsidies. The Uniform gross earnings is the value that is arrived at after making all these adjustments. To get the Uniform net earnings, maintenance capital expenditure is deducted from the Uniform gross earnings. The most common way to estimate the maintenance CAPEX is by determining the amount of depreciable assets and by dividing this amount by the asset life of the company.
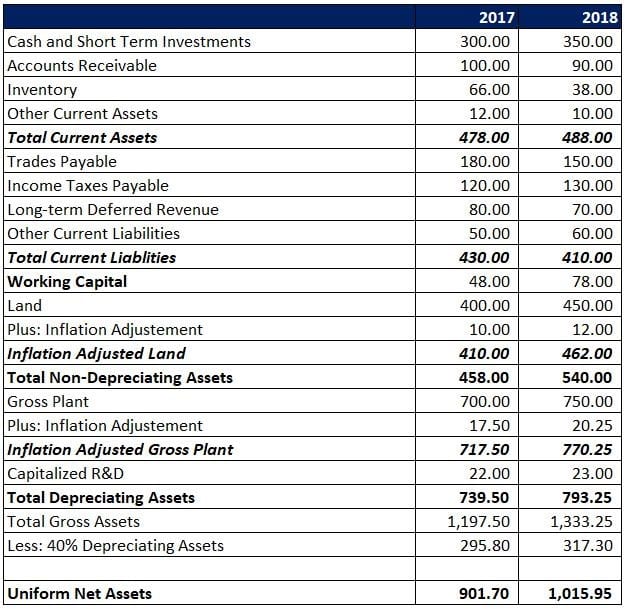
Before computing for the Uniform net assets (A′), one must know what comprises it. For any company, the net assets prime is the sum of all depreciable and non-depreciable assets. Depreciating assets are normally the fixed-assets of the company—property, plant and equipment, and capitalized R&D costs. They may also include some intangible assets (e.g. patents) that have finite lives and are being depreciated every period. The most common adjustments that are made in this group of assets is to separate land from the other fixed assets since it is non-depreciating, and more often than not, lumped by accounting systems under property, plant and equipment.
In addition, due to the time value of money, a dollar that is spent in the past to acquire equipment is not the same amount of dollar two to three years after acquisition. The depreciable assets amount has to be adjusted for the devaluation of money to accurately reflect how much investment they need to generate returns from. Not adjusting for currency devaluation may overstate the ROA’ of the company as inflation would make it seem that the company is generating more cash flow. On the other hand, non-depreciating assets include land, and working capital. Working capital is simply the company’s current assets minus its current liabilities. (Current assets are composed of cash, short term investments, accounts receivables, inventory and other current assets; current liabilities are composed of trades payables, income taxes payable, long-term deferred revenue, and other current liabilities.) Finally, land has to be adjusted for currency devaluation. Uniform gross assets is the sum of the aforementioned depreciating and non-depreciating assets. Then, 40% of depreciating assets is subtracted from the Uniform gross assets to arrive at the Uniform net assets. Below is a sample calculation of Uniform net assets.
After making all these adjustments, calculating Uniform ROA is simply a matter of dividing the Uniform net earnings by Uniform net assets.
Implications on Valuation
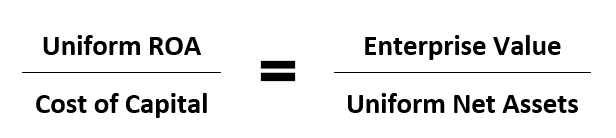
In order to create wealth, a firm must be able to generate returns above the cost of capital. Otherwise, wealth would be transferred from shareholders to creditors. To justify a company’s valuation, the ratio of Uniform ROA and the cost of capital (CoCap) must at least equal the ratio of the enterprise value and the Uniform net assets. If Uniform ROA/CoCap is lower than V/A′, without considering growth, the company is more or less overvalued. On the other hand, if the ratio is greater than its V/A′, the company is likely to be undervalued.
In summary, traditional metrics that are used for valuation do not fully capture the goal of the intermediate to long-term investor which is to create wealth. Most of these metrics are limited by their nature of dependency on arcane accounting information. They neither consider the time value of money, nor are they secure from accounting manipulations. Thus, they lead investors to focus on aspects that do not necessarily contribute to the creation of their wealth. It is in this context that the importance of Uniform ROA calculations come into play. Not only does Uniform ROA measure the creation of wealth, it also provides a more stable measurement for return. Uniform ROA is also much simpler to calculate than other performance metrics like RONA, IRR, and CROGA. The V/A′ to ROA′ valuation model eliminates the need to forecast earnings and other balance sheet items, which is common to other valuation models. Rather than focusing on estimating the terminal value of a company, the calculation of the ROA′ gives room for qualitative discussions about future earnings of the company.


