
Corporate America’s REAL earning power: how this chart helps explain the stock market’s cycles and clues into the market’s moves in 2020 and beyond

The great Ben Graham, father of value investing, talked in The Intelligent Investor about the importance of Earning Power for understanding in which companies to invest.
As-reported earning power (return on assets based on GAAP financial statements) would have anyone question Graham’s thinking. It seems like the stock market and earning power aren’t related – based on GAAP numbers.
However, when investors look at corrected data, Uniform data, you see the genius in Graham’s thinking.
Investor Essentials Daily:
The Monday Macro Report
Powered by Valens Research
In our Investor Essentials Daily earlier this month on Berkshire Hathaway’s portfolio we discussed how Ben Graham, the founder of modern value investing, regularly stressed the importance of “Earning Power” when talking about finding companies to invest in.
Most investors would agree, earnings growth is the most important driver of a stock rising in value.
If earnings don’t grow, or market perception of earnings don’t change, stocks won’t rise. But if earnings or market expectations for earnings do change, stocks move.
This is as true for the market as it is for individual companies.

The S&P 500 peaked at 1,500 in March 2000. Then, a sell-off occured driven by the tech bubble burst and the recession of 2000-2001.
The market didn’t reach new highs until mid-2007. Shortly after making this “double top,” the market rolled over. The US residential market collapse and its impact on the US and global financial system led to the market dropping to 666 by March 2009 in the midst of the Great Recession.
It wasn’t until 2013 that the market broke 2007 highs. Since then, the market has continued to rally, doubling 2007 peaks by 2019, and rising even further…
Investors would likely assume that earning power, as Ben Graham would say, has been the driving force behind these trends.
One way we can see if that is the case is by looking at return on assets (ROA) to see if the trend has tracked the market index’s trends.
The chart below highlights aggregate U.S. profitability in terms of as-reported ROA.
US Aggregate – Corporate America ROA (As-Reported)
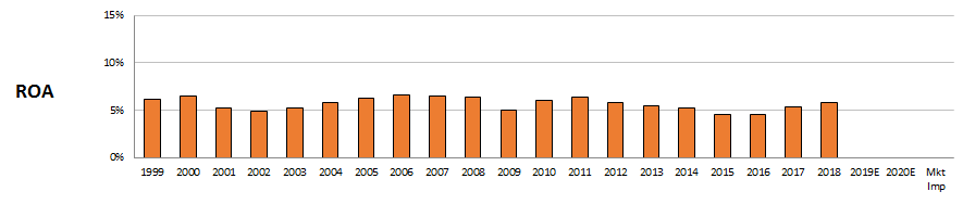
For those without better data, this chart could call into question the premise that earnings growth and earning power directly drive market valuations.
While profitability trends in 2006-2008 help explain the market’s rise from 2000, in every year since, returns have been lower. From 2013-2015, the market rallied higher, but as-reported ROA was falling to historical lows.
With minimum earning power in 2015 and 2016 and median levels more recently, it would seem to not be in sync with the stock market at all. The chart does not track with the US stock market’s performance.
How has the stock market been making new all-time highs if earning power is declining? Does the market just not get it? Or are there other factors that are causing market appreciation?
Well, it turns out that the as-reported numbers are just wrong.
When Ben Graham was talking about earning power, he was talking about REAL earning power. Today, the as-reported numbers are so distorted that they don’t represent earning power at all.
When we make our Uniform Accounting adjustments and look at the real numbers, everything comes into much clearer focus…
The below panel explains U.S. aggregate historical corporate performance levels, in terms of Uniform ROA (dark blue bars) versus what sell-side analysts think the aggregate is going to do the next 2 years (light blue bars) and what the market is pricing in at current valuations (red bar).
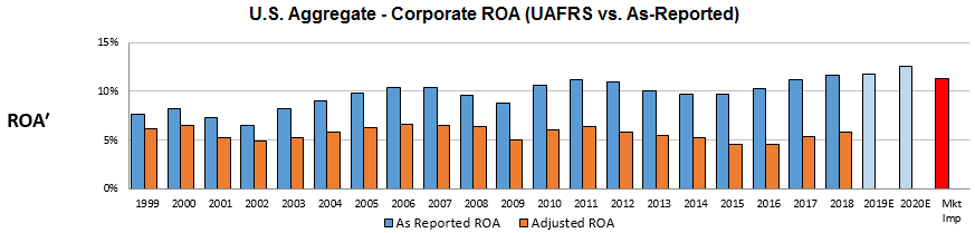
When removing the noise associated with GAAP distortions, especially around issues like acquisition distortions, R&D expensing, excess cash, and stock option expense, it becomes clear that US corporate earning power is totally in line with stock market appreciation.
In fact, it is not just in a good place—US corporate profitability is at all-time highs.
With the right data, the movement of the S&P 500 the past 20 years makes more sense.
After dropping in 2001 and 2002, Uniform ROA levels reached 10% in 2006 and 2007. These levels exceeded the levels of 1999-2000, just as the market was making new all-time highs.
Then after dropping in 2008 and 2009, Uniform ROA again reached new peaks in 2011 and 2012. By early 2013, the market was making new all-time highs.
After falling due to energy market headwinds from 2013-2015, Uniform ROA is now at 12%, over double the long-term global corporate average.
The recovery in ROA has also lined up with the market’s ability to make new all-time highs through 2016-2020, as does the forecast for continued expansion in Uniform ROA.
Each time over the past 20 years, the as-reported numbers said corporate profitability only approached prior highs before rolling over. The real numbers said we were breaking records. The market clearly has been paying attention to the real Uniform Accounting numbers.
Earnings growth, and growth in returns or earning power, has driven the stock market higher.
With the stock market near all-time highs, one might ask if the market is already pricing this to continue. If the market already believes returns are going to rise higher, then any continued improvement wouldn’t move stocks higher; it would just justify current expectations.
The red bar in the chart above represents the returns the market is paying for right now. While US corporates are producing 12% returns, the market is expecting returns to fall going forward. Market expectations are not excessive.
If corporations continue to make operational improvements, and continue the shift to higher value-add activities, there are structural reasons to expect earning power to continue to rise. And with limited risk of a recession causing cyclical headwinds in the future, as we discussed a few weeks ago, there are fundamental reasons for the market to start to recognize this, meaning further stock appreciation.
All the best, as always,
Joel Litman & Rob Spivey
Chief Investment Strategist &
Director of Research
at Valens Research


