
Did a hedge fund great play in the World Series?

In October, we looked at one of the greatest hedge fund managers of all time who took the grandfather of value investing’s teachings, and expanded them while generating impressive returns.
He is a rare success story of someone who said how they were going to beat the market before they did it, and then went out and produced world beating returns for over 30 years.
Below is the story we told about him in October, including an updated portfolio analysis for his fund, based on his fund’s latest 13-F.
In addition to examining the portfolio, we’re including a deeper look into the fund’s largest current holding, providing you with the current Uniform Accounting Performance and Valuation Tearsheet for that company.
Investor Essentials Daily:
Friday Uniform Portfolio Analytics
Powered by Valens Research
It’s game 3 of the 1932 World Series, and the score is tied 4-4 in the 5th inning.
October baseball is always special, but an at bat in a tied game in the World Series is a true pressure cooker.
Babe Ruth strode to the plate for the Yankees, facing the Chicago Cubs in Wrigley Field.
As he takes strike one, the Cubs bench players are jeering at him and the Wrigleyville faithful are screaming any insult they can think of.
Ruth doesn’t tune them out. Instead, he steps one foot out of the batter’s box and points the head of his bat to the deepest part of center field. He steps back into the box.
He takes strike two.
The fans, the players, the atmosphere only gets louder. They smell blood.
Ruth steps out and, again, uses his bat to point to the Exact. Same. Place. He’s calling his shot!
He steps back into the batter’s box…and Charlie Root throws a curveball that never makes it to the catchers mitt.
Instead it ends up over 440 feet away into the center field stands. Exactly where he said he would.
The Yankees went on to win the game 7-5, and to win the series also. Baseball fans have loved telling that story every day since.
That story has such staying power because of the improbability of it. It’s easy for a pitcher to say after a no-hitter that he felt like something special was going to happen as he warmed up that afternoon.
It’s easy to look back and call David Ortiz one of the most clutch players of all time after he helped the Red Sox win 3 world series. But to be able to call your shot, not just that you were going to get a hit, but that you were going to hit a home run, over right center field, is near impossible.
Which is why it’s so impressive that sixty years later, Seth Klarman did the exact same thing—it’s why he’s a legend in investing, almost to the scale Babe Ruth is in baseball.
Seth Klarman has been a wildly successful investor. His fund Baupost has produced 20% returns a year since 1983. He’s outperformed the market by almost 4x since he started the strategy.
But what’s impressive isn’t just that he has had such phenomenal returns. It’s that he told everyone how he was going to get those returns before he did.
Long before Klarman became a billionaire he wrote a book called Margin of Safety. The name is an homage to Ben Graham’s Security Analysis.
In the book, Klarman laid out his value investing philosophy and how he would pick stocks. He laid out his exact strategy that would eventually lead to Baupost’s phenomenal performance. He called his shot and then he delivered 4x the market’s performance.
Klarman and Baupost are still picking stocks today, and doing an amazing job.
Part of the reason they remain so successful is because Klarman has as much skepticism about as-reported accounting metrics as we do here at Valens.
Klarman has regularly railed against the issues with as-reported accounting metrics. Mocking investors who use metrics like EBIT and EBITDA to value companies, because of how distorted they are.
At Baupost, they are focused on the real operating profitability of companies, not the inaccurate noise of as-reported accounting metrics.
To show how Baupost’s analysis unsurprisingly lines up with Valens Uniform Accounting, we’ve done a high level portfolio audit of Baupost’s current portfolio, based on their most recent 13-F. This is a light version of what we do for our institutional clients when we analyze their portfolios for torpedos and companies they may want to “lean in” on.
See for yourself below.
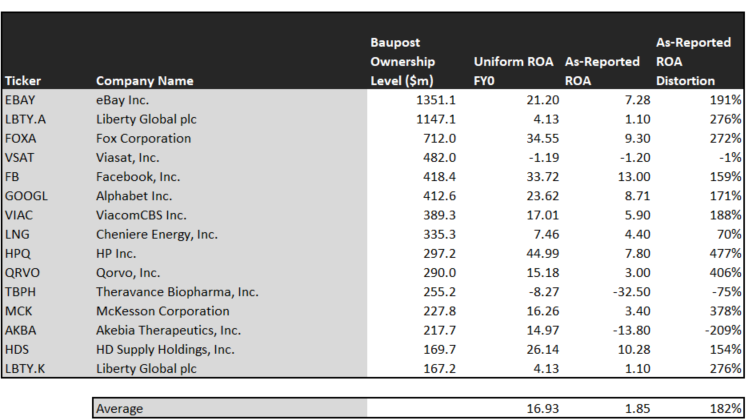
Using as-reported accounting, investors would think Baupost was not focusing on companies that provided them much margin of safety, given the companies in the portfolio have very weak return on assets (ROA).
On an as-reported basis, many of these companies are poor performers with returns below 5%, and the average as-reported return on assets (ROA) is right at 2%.
In reality, the average company in the portfolio displays an impressive average Uniform ROA at 17%—that’s above corporate average returns currently. These are the kind of companies that likely have strong economic moats offering real fundamental visibility for Klarman and Baupost to understand the companies’ margin of safety.
Once the distortions from as-reported accounting are removed, we can realize that Facebook (FB) doesn’t have a 13% ROA, it is actually at 35%. Facebook is a cash generating machine that has earned its massive valuation.
Similarly, Alphabet’s (GOOGL) ROA is really 24%, not 9%. While as-reported metrics are portraying the company as a middling online search business, Uniform Accounting shows the company’s real robust operations.
Akebia Therapeutics (AKBA) is another great example of as-reported metrics mis-representing the company’s profitability.
Akebia’s ROA isn’t negative 14%, it is actually positive at 15%. Baupost appears to understand that market expectations for the company, thinking it’s a negative return business, are completely incorrect.
The list goes on from there, for names ranging from eBay (EBAY) and Liberty Global (LBTY.A), to Fox Corporation (FOXA), HP (HPQ), and McKesson (MCK).
If Baupost were focused on as-reported metrics, it would never pick most of these companies because they do not look like companies that would provide the fund with the margin of safety it desires in its investments.
But to find companies that can deliver alpha beyond the market, just finding companies where as-reported metrics mis-represent a company’s real profitability is insufficient.
To really generate alpha, any investor also needs to identify where the market is significantly undervaluing the company’s potential.
Klarman and Baupost are also investing in companies that the market has low expectations for, low expectations the companies can exceed.
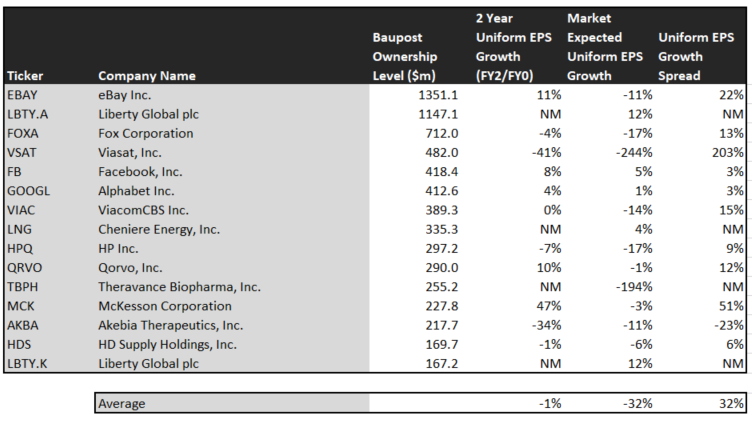
This chart shows three interesting data points:
- The 2-year Uniform EPS growth represents what Uniform earnings growth is forecast to be over the next two years. The EPS number used is the value of when we take consensus Wall Street estimates and we convert them to the Uniform Accounting framework.
- The market expected Uniform EPS growth is what the market thinks Uniform earnings growth is going to be for the next two years. Here, we show by how much the company needs to grow Uniform earnings in the next 2 years to justify the current stock price of the company. If you’ve been reading our daily analyses and reports for a while, you’ll be familiar with the term embedded expectations. This is the market’s embedded expectations for uniform earnings growth.
- The Uniform EPS growth spread is the spread between how much the company’s Uniform earnings could grow if the Uniform earnings estimates are right, and what the market expects Uniform earnings growth to be.
The average company in the US is forecast to have 5% annual Uniform Accounting earnings growth over the next 2 years. Baupost’s holdings are forecast by analysts to lag that, the median company is forecast to have 1% a year earnings decline the next 2 years.
But while the companies in the portfolio aren’t forecast to grow significantly in the middle of the pandemic, Baupost gets a margin of safety on its investments by identifying companies where the market is even more pessimistic for growth than what the companies are forecast to generate.
On average, the market is pricing these companies to shrink earnings by 32% a year. While these companies are growing robustly, they are intrinsically undervalued, as the market is mispricing their growth by 31%-32% on average.
These are the kinds of companies that are likely to see their stocks rally when the market realizes how wrong it is. Without Uniform numbers, the GAAP numbers would leave everyone confused. And the risk of returns collapsing is low, considering how high quality these companies are.
One example of a company in the Baupost portfolio that has growth potential that the market is mispricing is eBay (EBAY), Baupost’s largest holding. eBay’s Wall Street analyst forecasts have 11% Uniform earnings growth built in, but the market is pricing the company to have earnings shrink by 11% each year for the next two years.
Another company with similar dislocations is McKesson (MCK). The market is expectating 3% decline in earnings. However, the company is actually forecast for Uniform EPS to grow by 47% a year.
Yet another is the fund’s largest holding, Fox Corporation (FOXA), is priced for 17% decline in Uniform earnings, when the company is forecast to only see earnings decline by 4% a year.
That being said, there are a few companies we’d recommend Baupost look at again before holding. Either the rest of the market has not caught up with what Baupost is seeing for the company, or Klarman has misjudged these companies’ growth.
Akebia (AKBA) is forecast to see Uniform earnings shrink by 34% a year going forward. However, the market is pricing the company for only 11% annual earnings shrinkage.
This doesn’t look like an intrinsically undervalued company. If anything, the market looks significantly too bullish.
But most of Baupost’s holdings clearly look like companies with the margin of safety that Klarman would be focused on. It wouldn’t be clear under GAAP, but unsurprisingly Uniform Accounting sees the same signals that Baupost appears to.
Liberty Global plc Tearsheet
As Baupost Group’s second largest individual stock holding, we’re highlighting Liberty Global plc’s tearsheet today.
As our Uniform Accounting tearsheet for Liberty Global plc (LBTY.A) highlights, Liberty Global trades at a Uniform P/E of 14.9x, below corporate average valuation levels and its own recent history.
Low P/Es require low EPS growth to sustain them. In the case of Liberty Global, the company recently had a 104% Uniform EPS growth.
While Wall Street stock recommendations and valuations poorly track reality, Wall Street analysts have a strong grasp on near-term financial forecasts like revenue and earnings.
As such, we use Wall Street GAAP earnings estimates as a starting point for our Uniform Earnings forecasts. When we do this, we can see that Liberty Global is forecast to see Uniform EPS shrinkage of 153% in 2020 followed by 9% growth in 2021.
Based on current stock market valuations, we can back into the required earnings growth rate that would justify $22 per share. These are often referred to as market embedded expectations.
In order to meet the current market valuation levels of Liberty Global, the company would have to grow Uniform EPS by 12% each year over the next three years.
What Wall Street analysts expect for Liberty Global’s earnings growth is far below what the current stock market valuation requires.
The company’s earning power, based on its Uniform return on assets calculation, is below corporate average returns. However, with cash flows and cash on hand consistently exceeding debt obligations, Liberty Global has low credit and dividend risk.
To conclude, Liberty Global’s Uniform earnings growth and valuation are both trading below peer averages.
Best regards,
Joel Litman
Chief Investment Strategist
at Valens Research


